Real-time cricket scorecard

Look
The market leader for online cricket scorecards in 2014 was ESPN CricInfo. Below is how a typical scorecard would look. It was text heavy, multi-tab and multi-page.

Most people following cricket online are living in the ALT-TAB world — on one tab they are working and on the other they are reading the scorecard. The scorecard should be one screenful of information, there should not be any scrolling and it should be very easy for the audience to compare the changes in the score compared to the previous time they saw the scorecard.
See
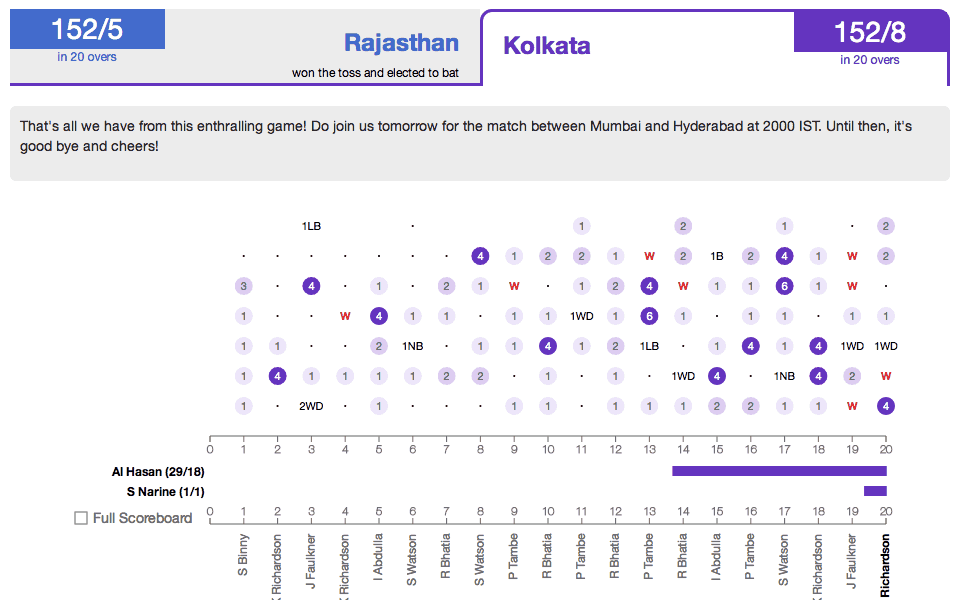
Overs is the notion of time in a cricket match. One over has many balls, has one bowler and has two batsmen. Existence of batsmen across overs is partnerships. Partnerships and fall of wickets are two different perspectives of the same data set.

Imagine
Fours and sixes are highlighted. Dot balls are shown with a full stop (which is cleaner than showing 0). The current ball is shown using a blinking cursor. Wickets are outliers and hence highlighted in red. A gantt chart showcases partnerships. End of partnership is fall of wicket.


Act


Compare the experience against ESPN CricInfo’s scorecard. This reimagined scorecard resulted in a significant increase in the active users in the client’s online sports section

Outcomes
The scorecard was showcased and our co-founder Ritvvij Parrikh was interviewed in a History Channel Documentary show – Vital Stats of India.

