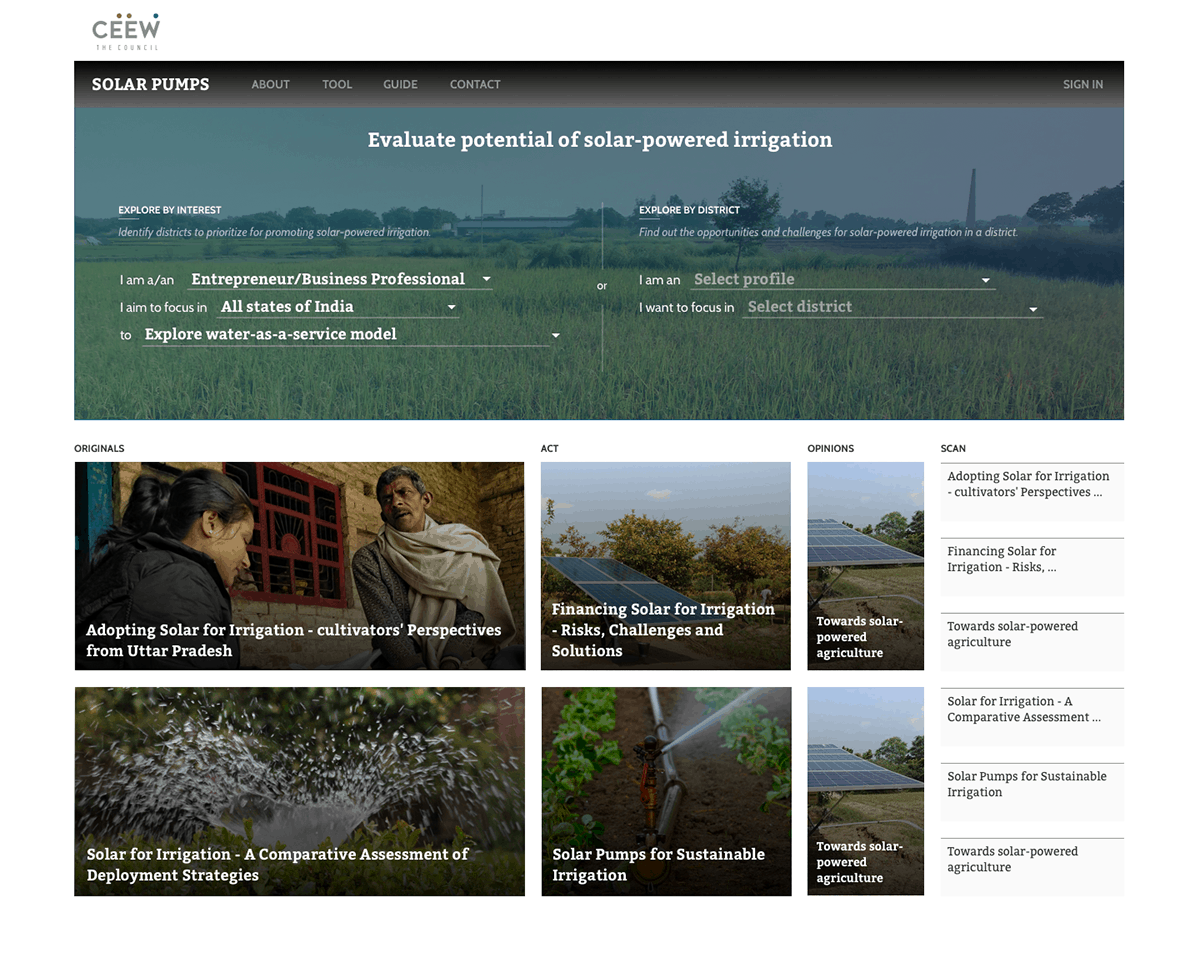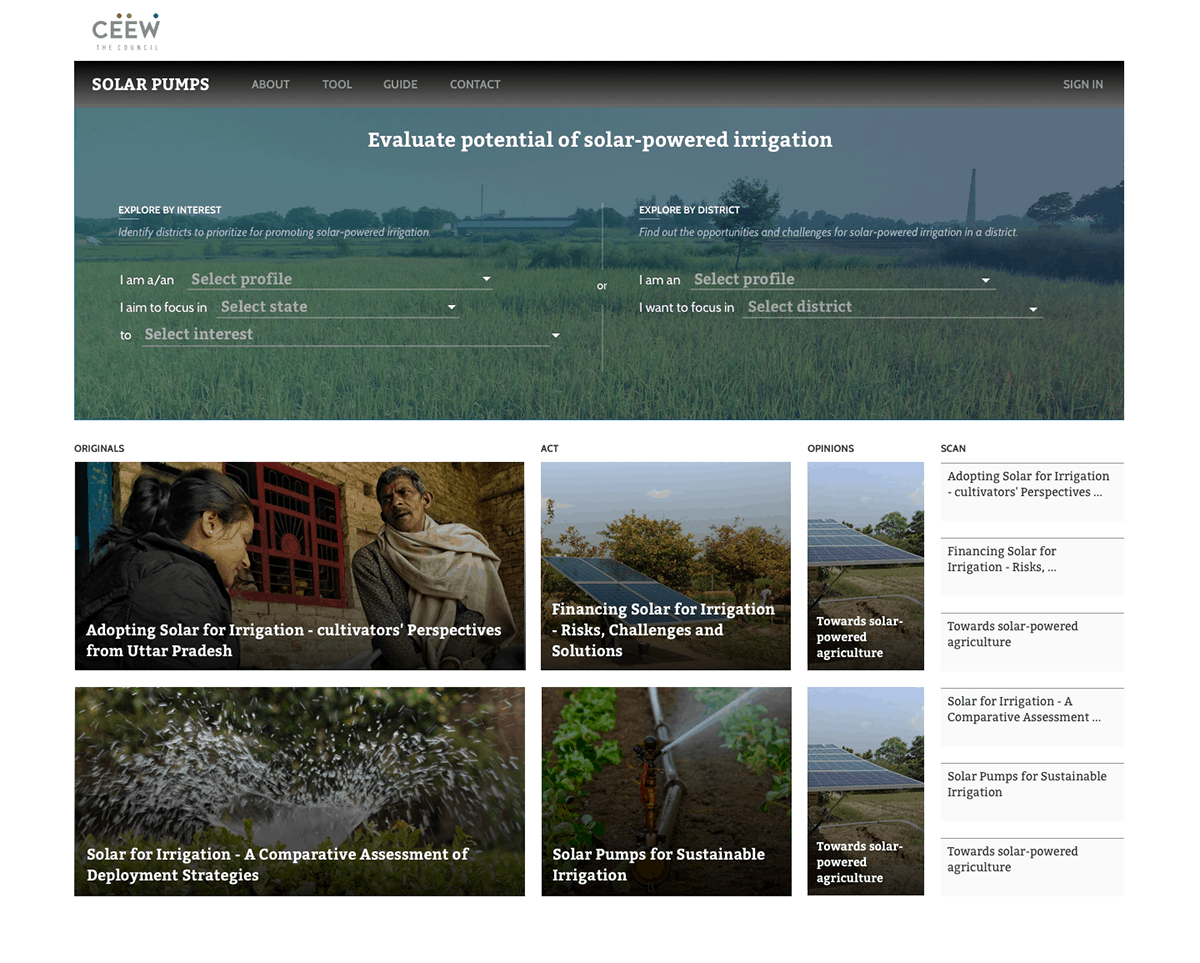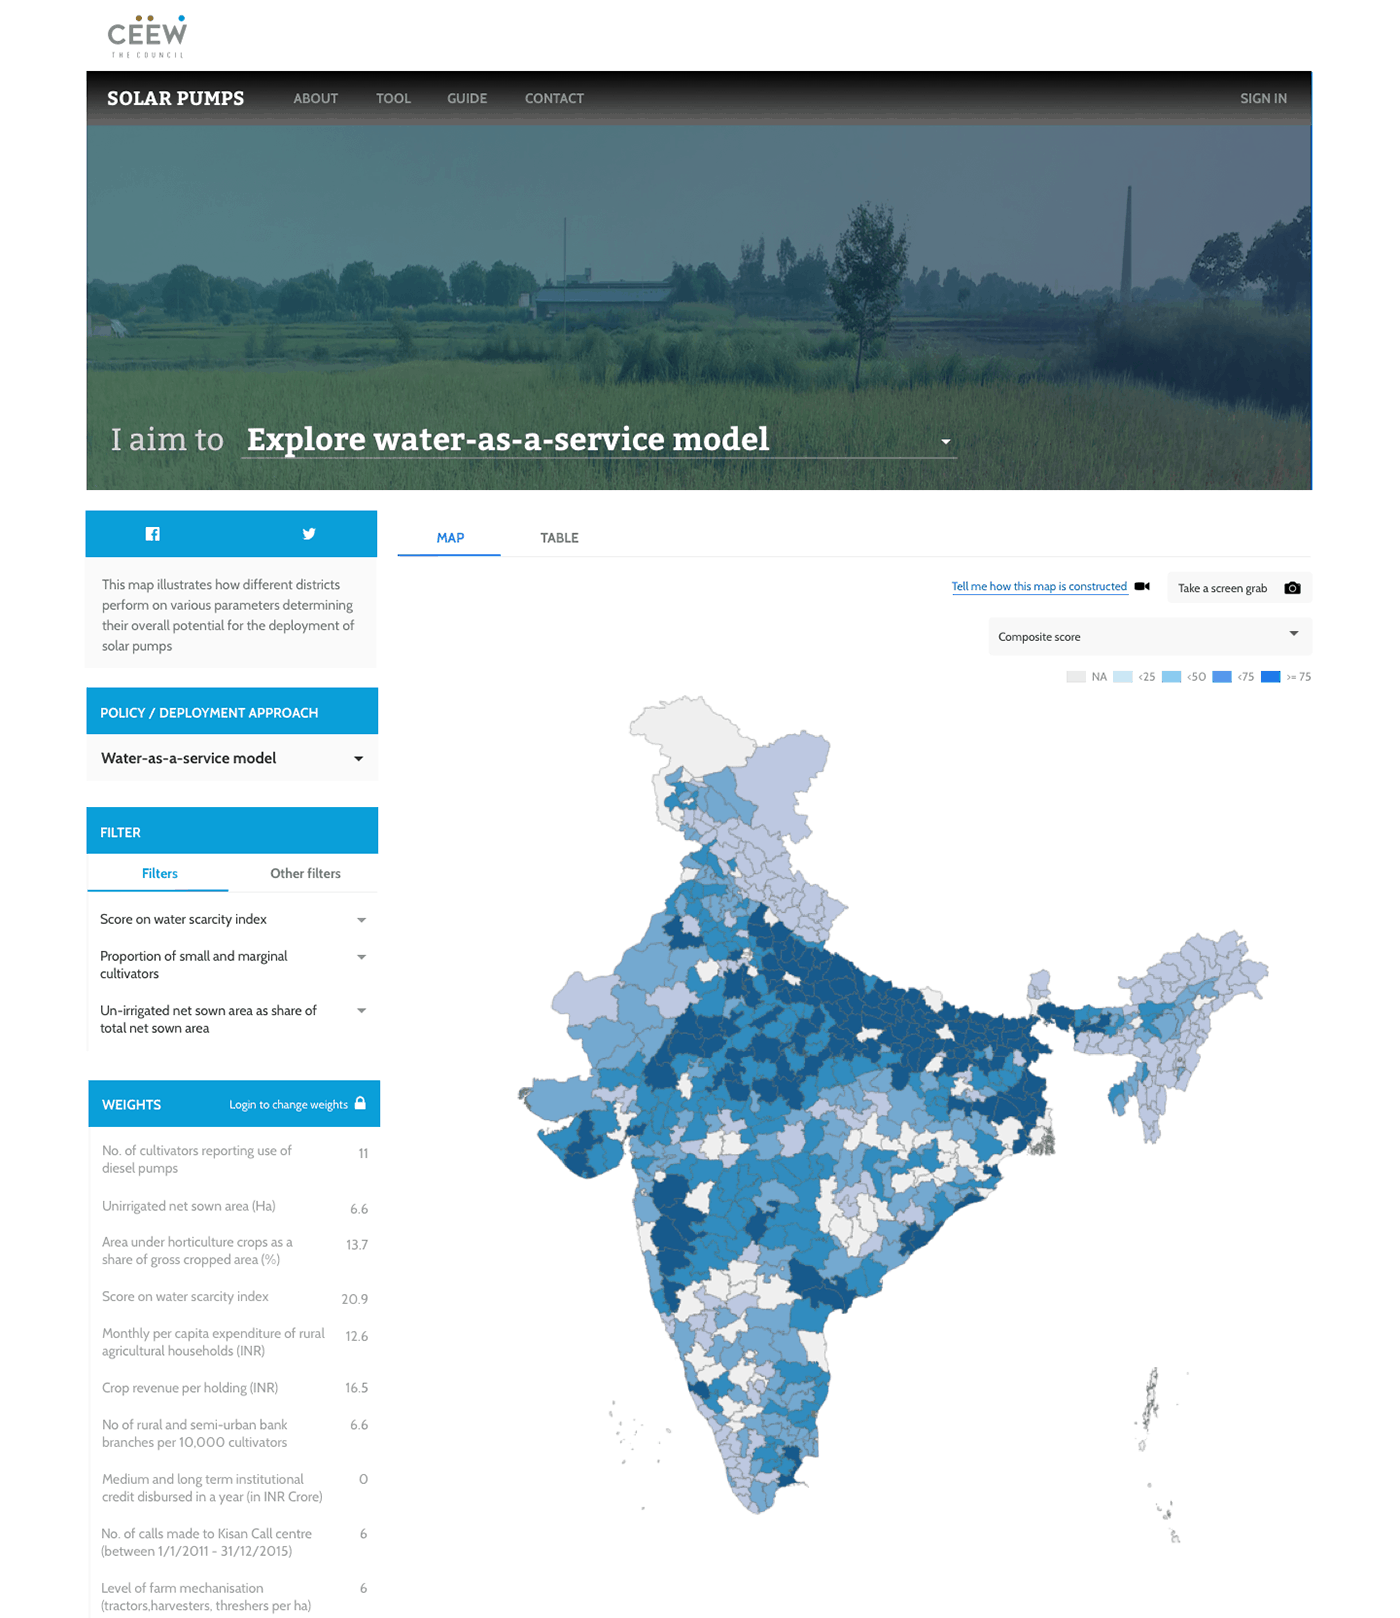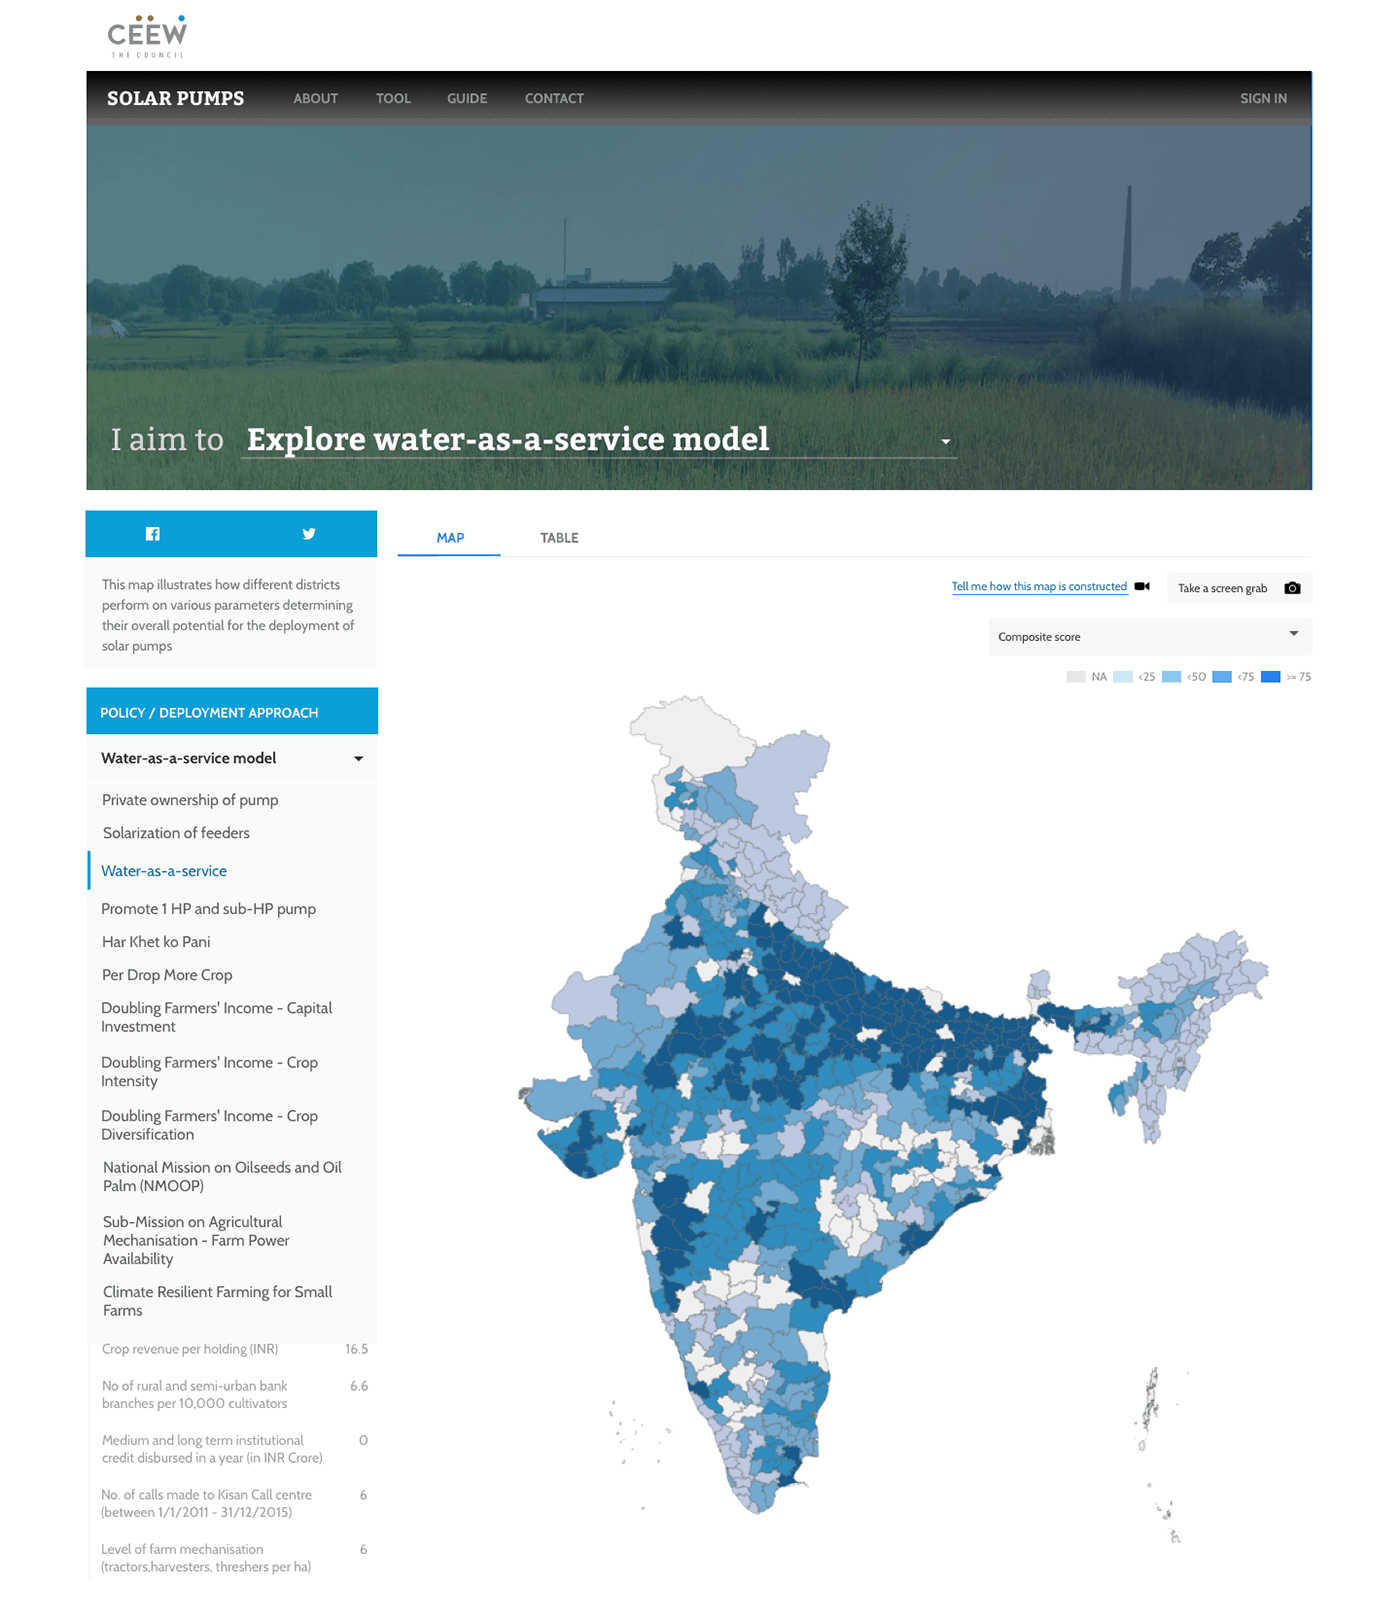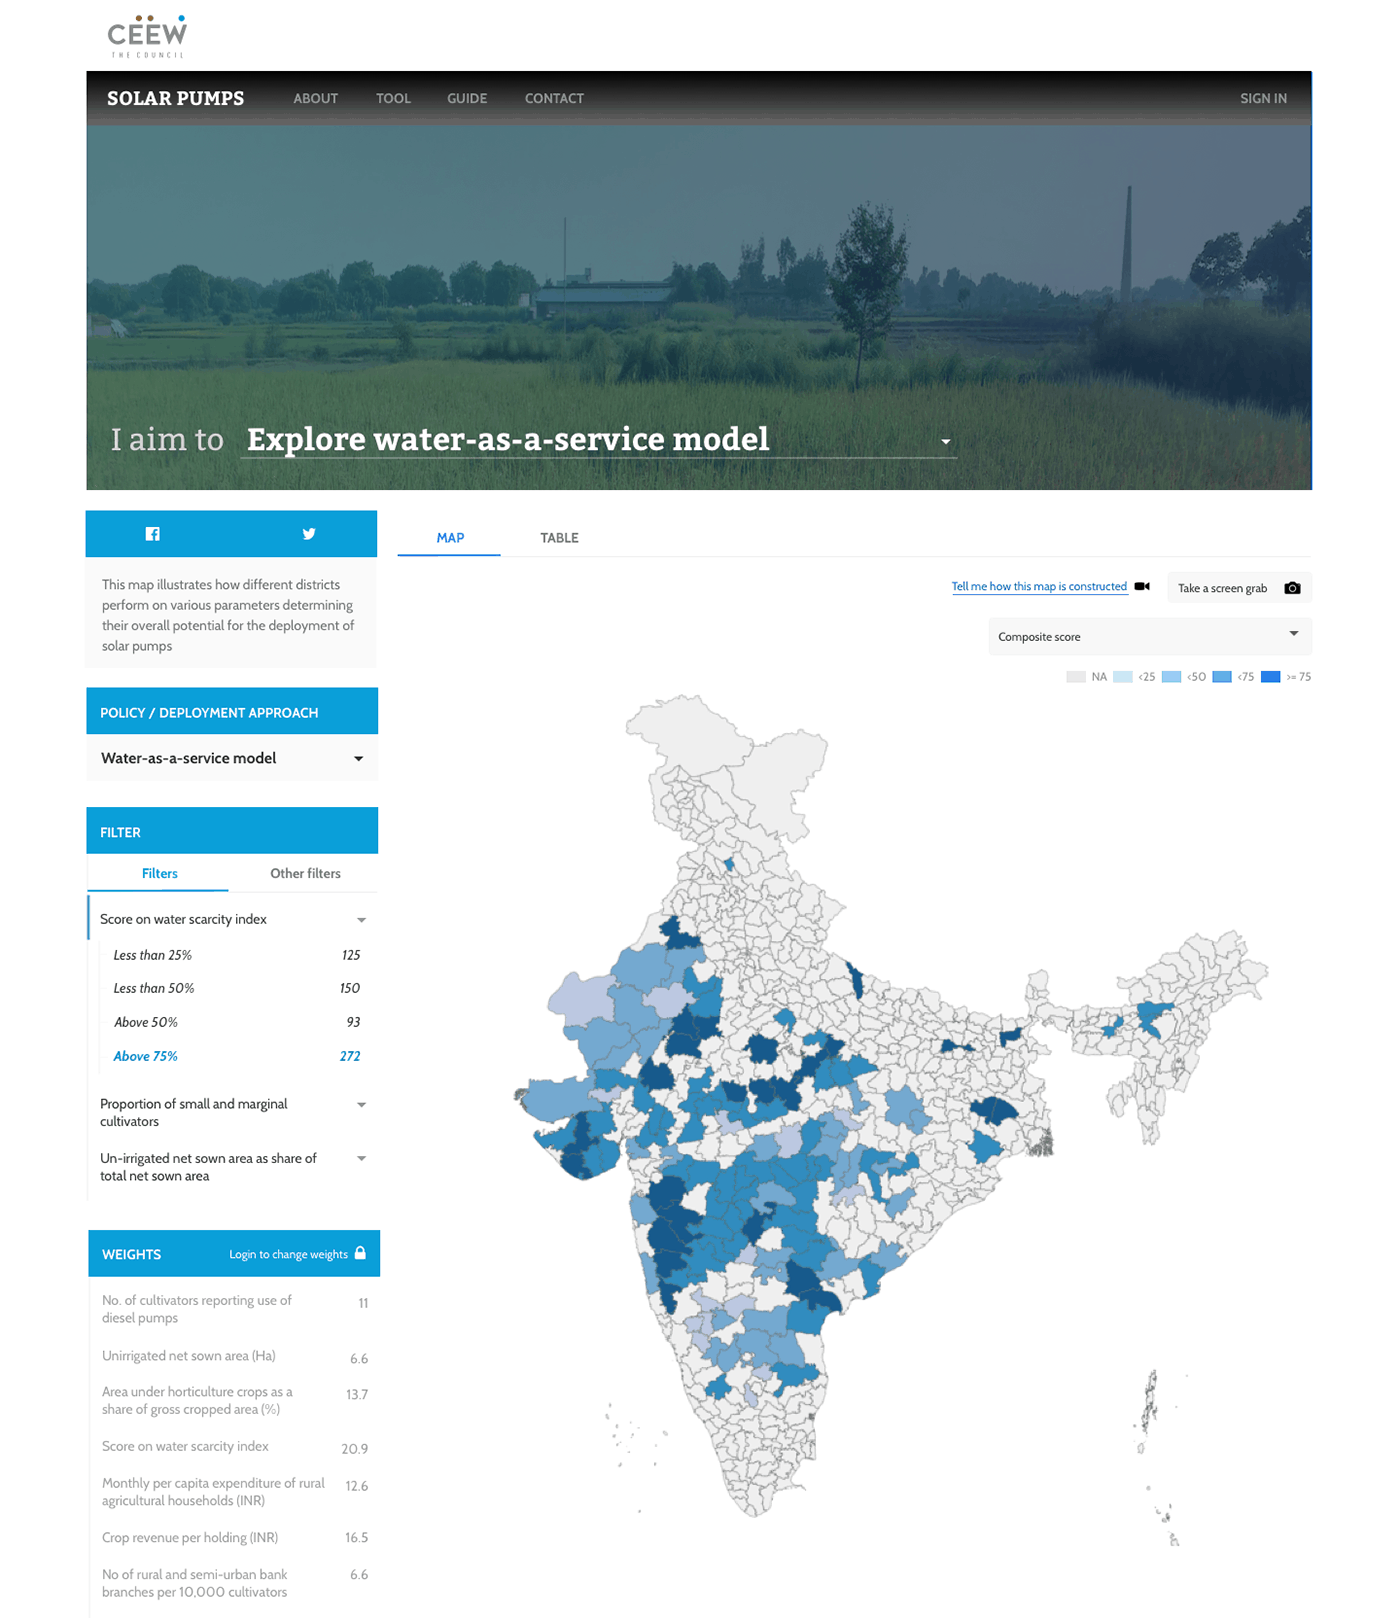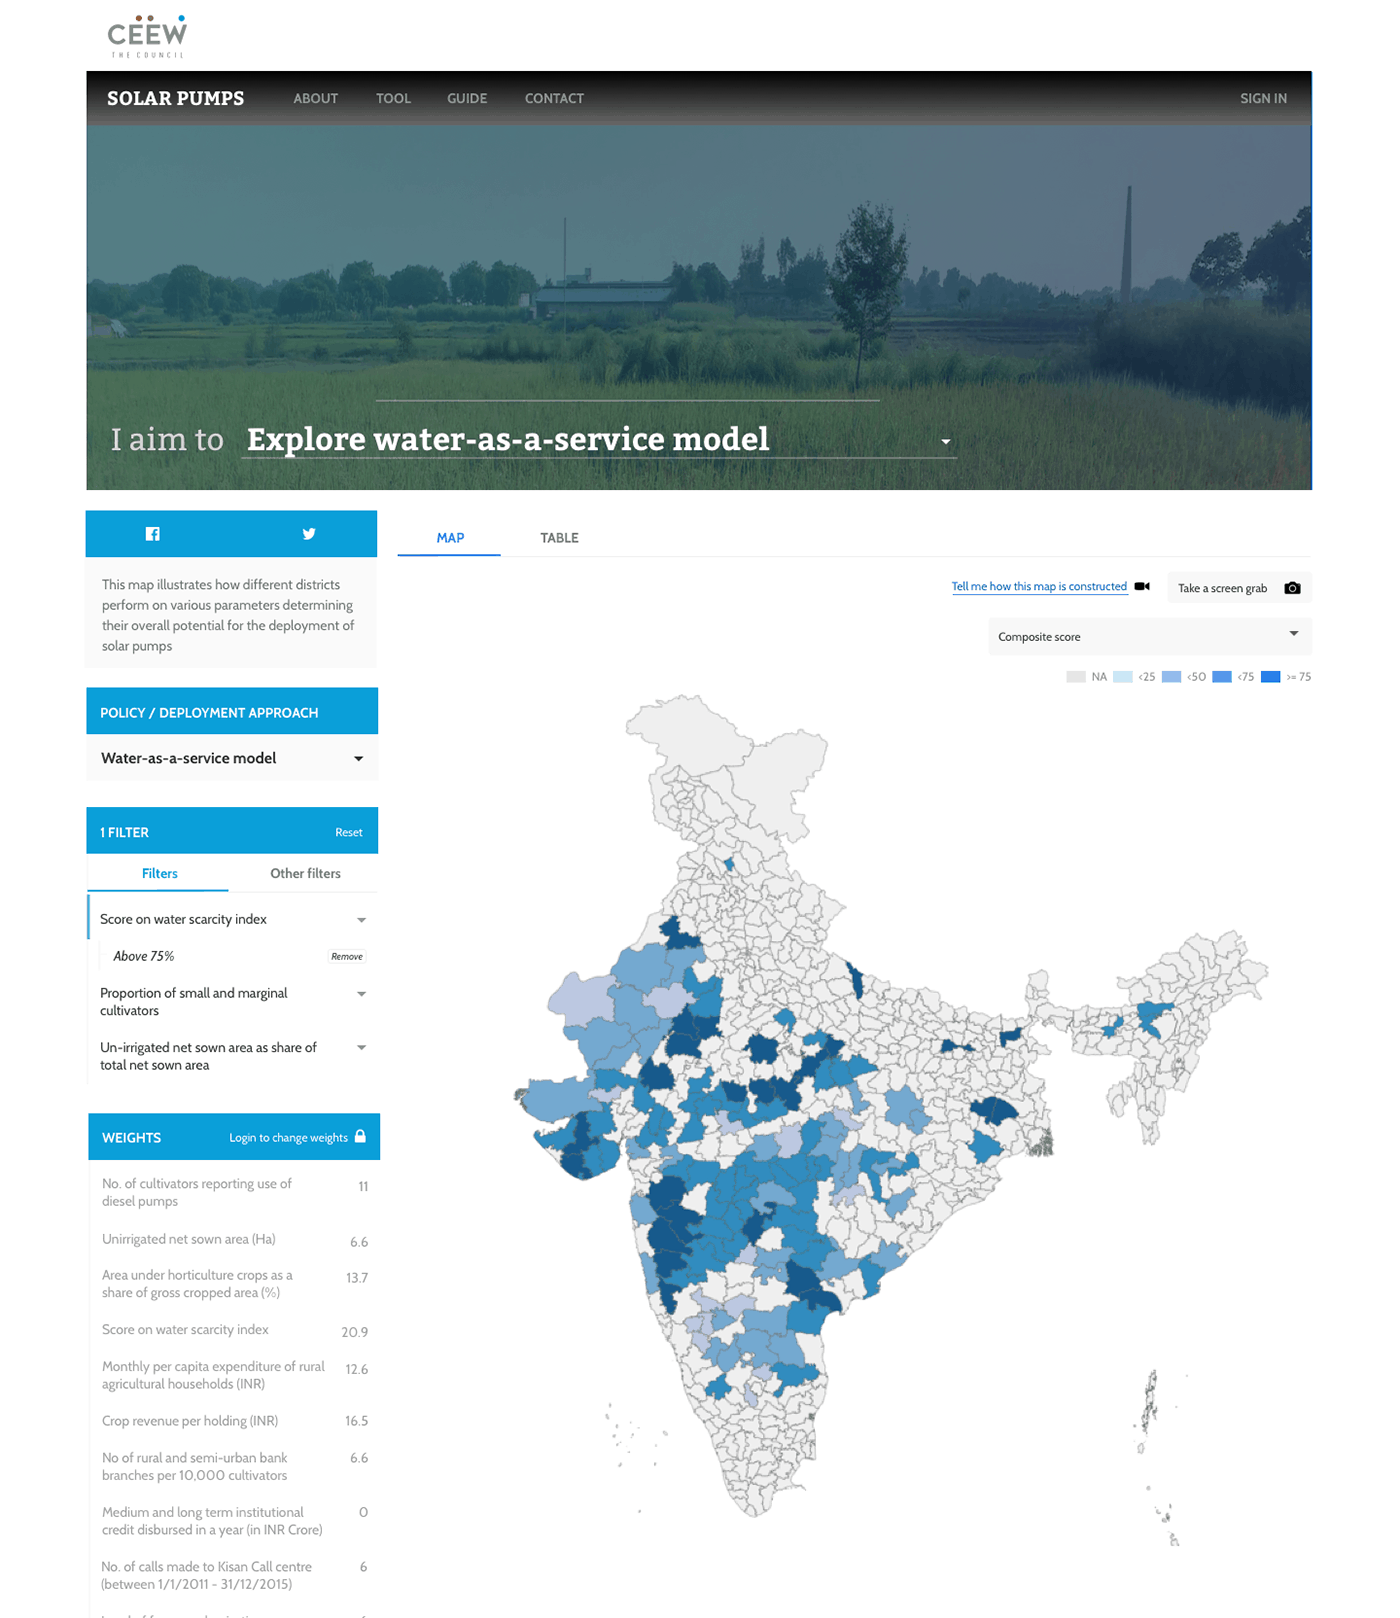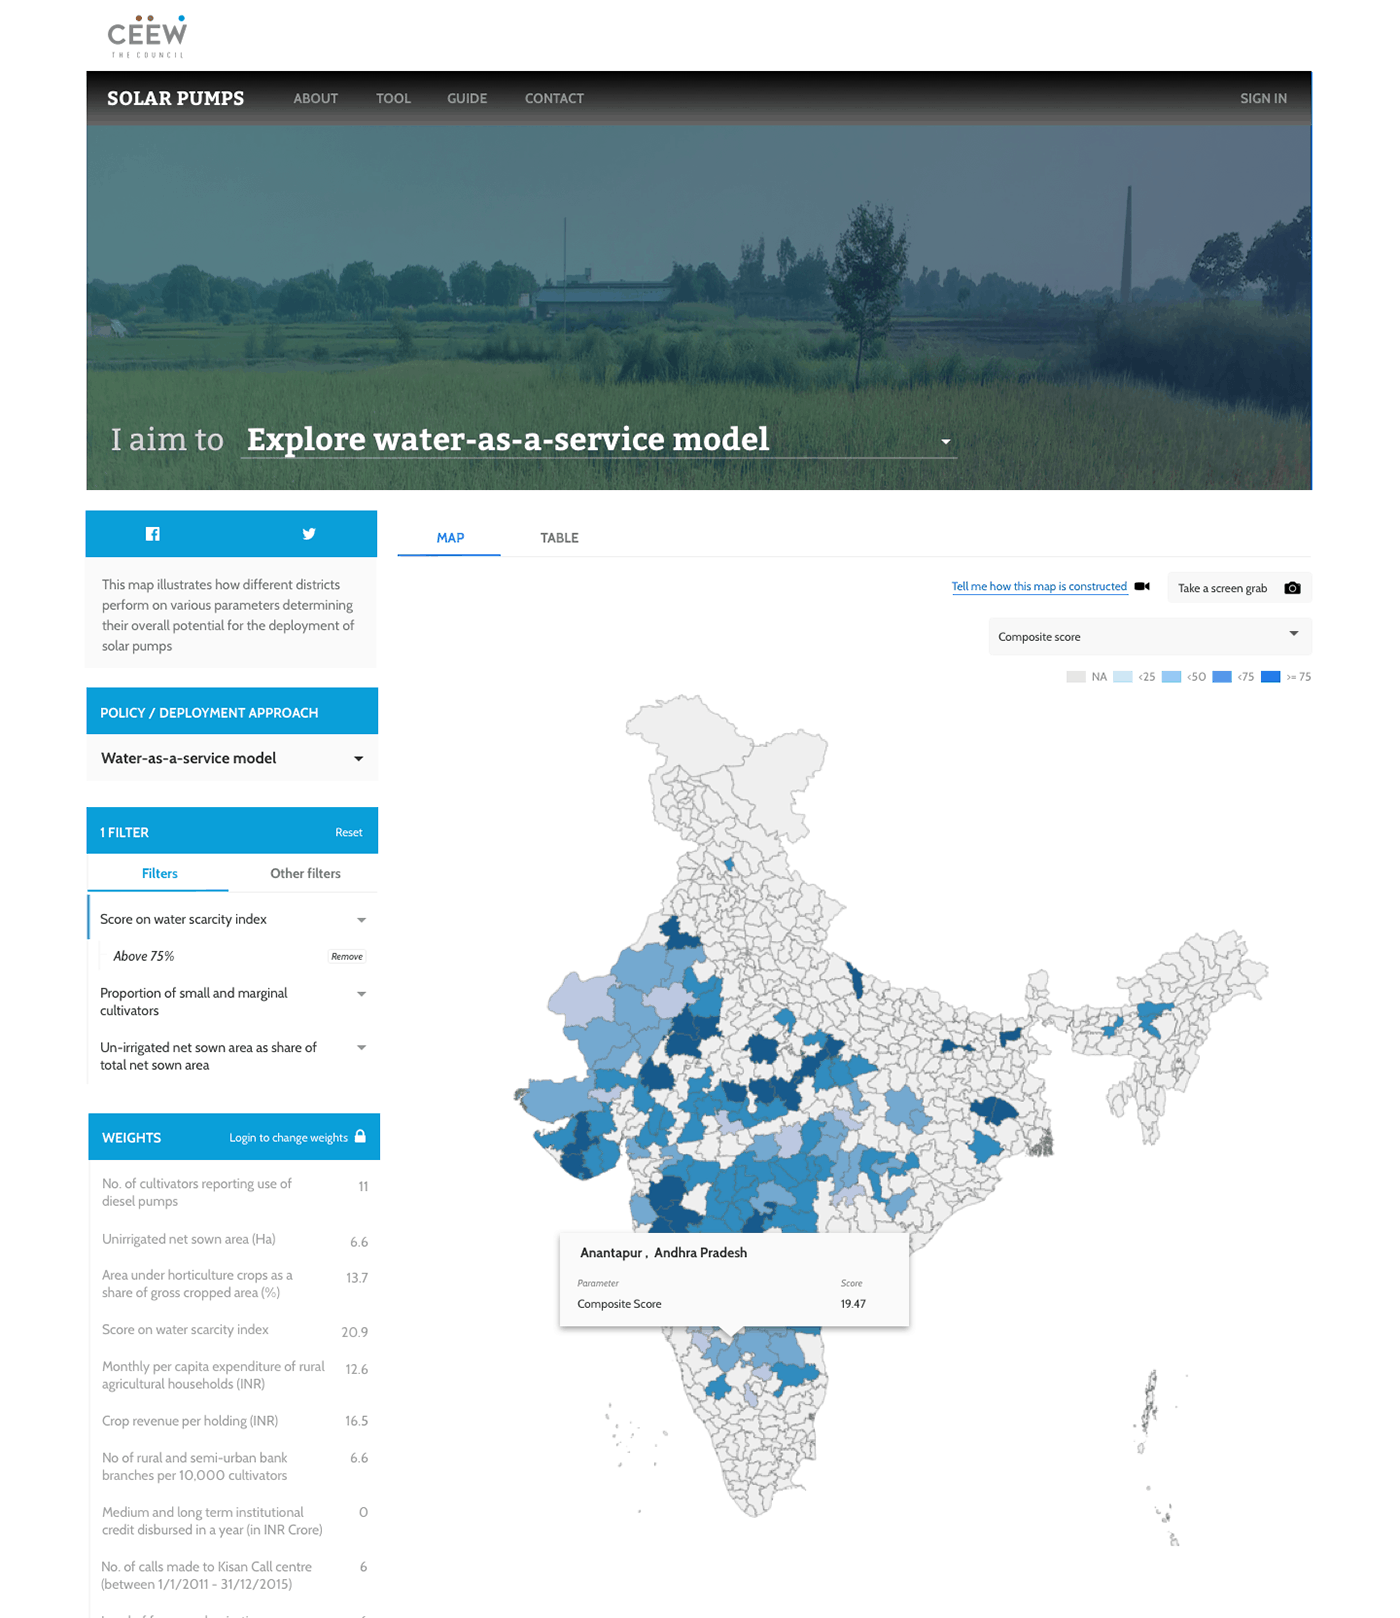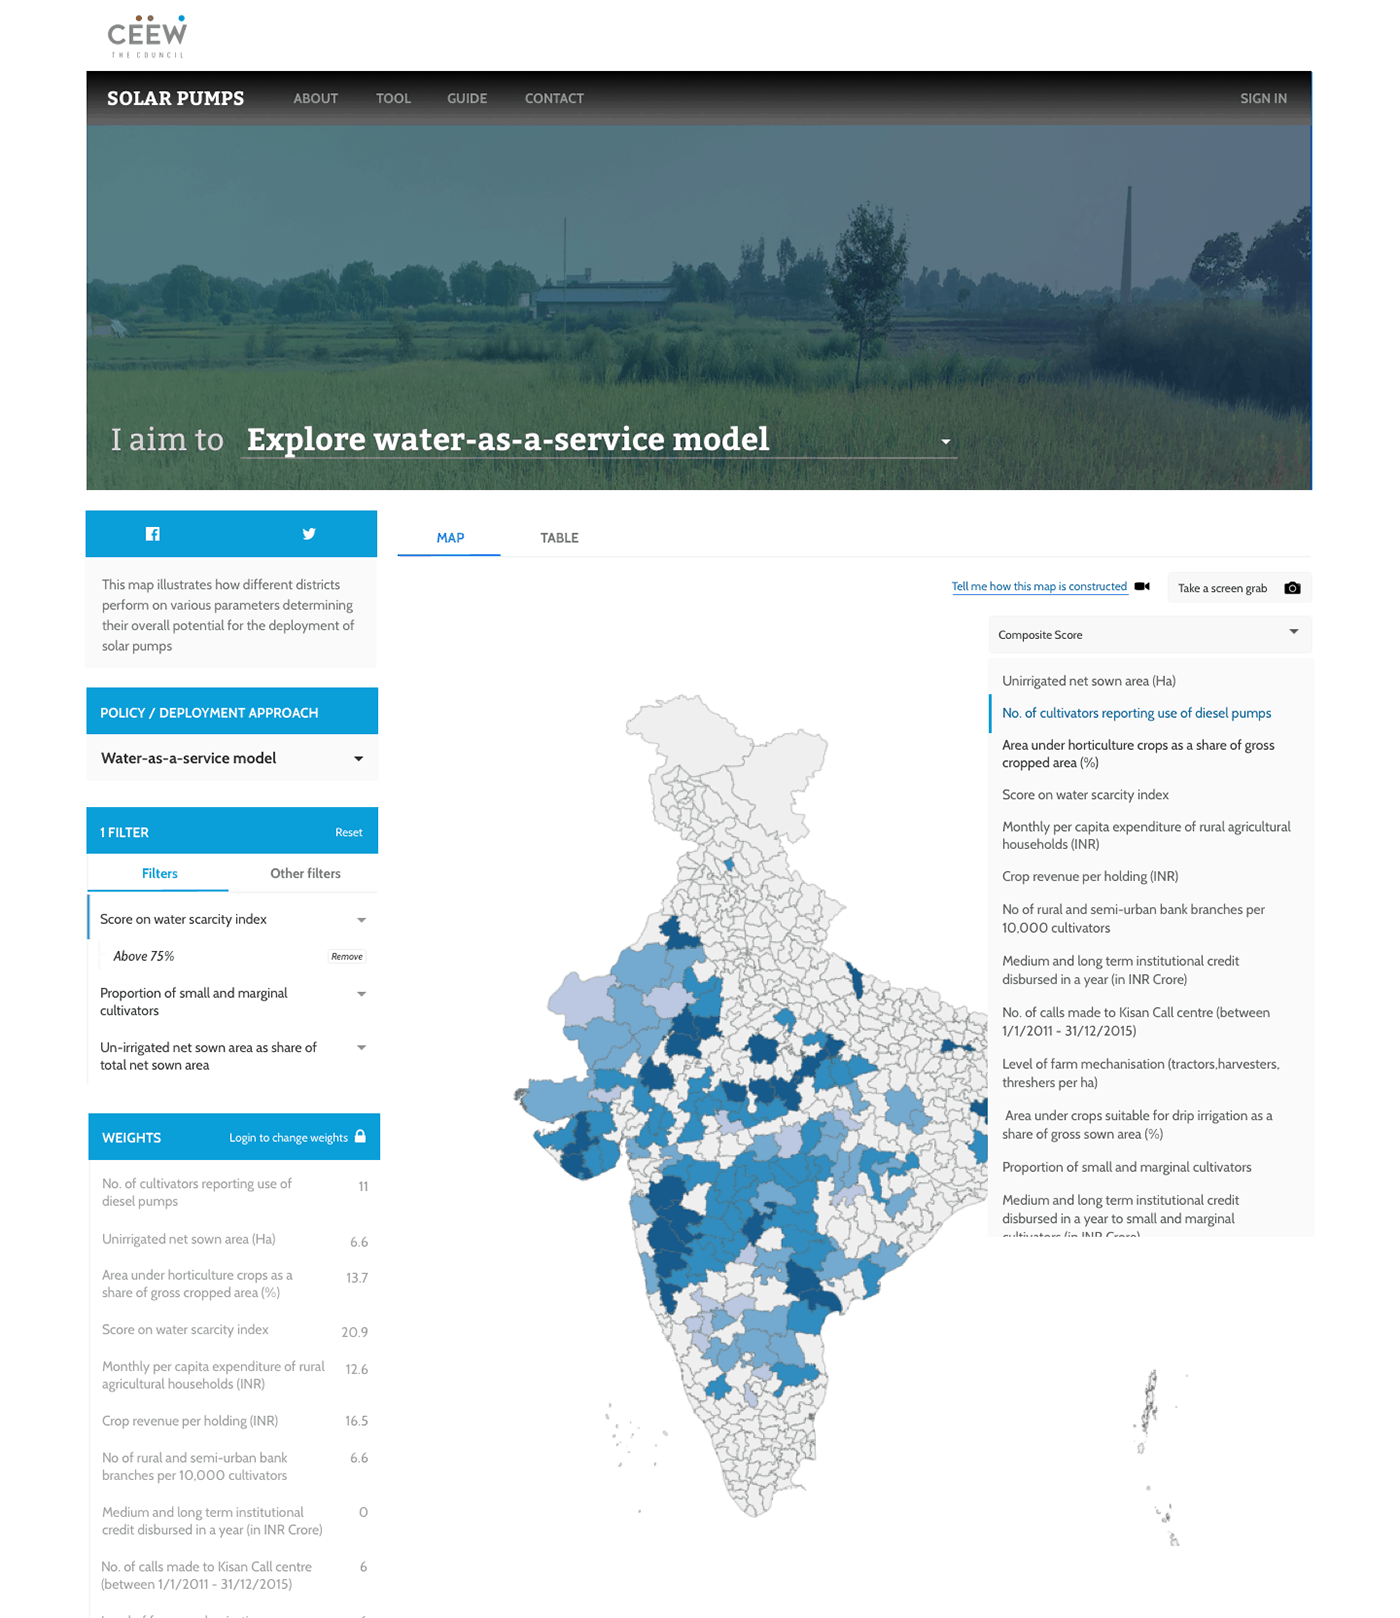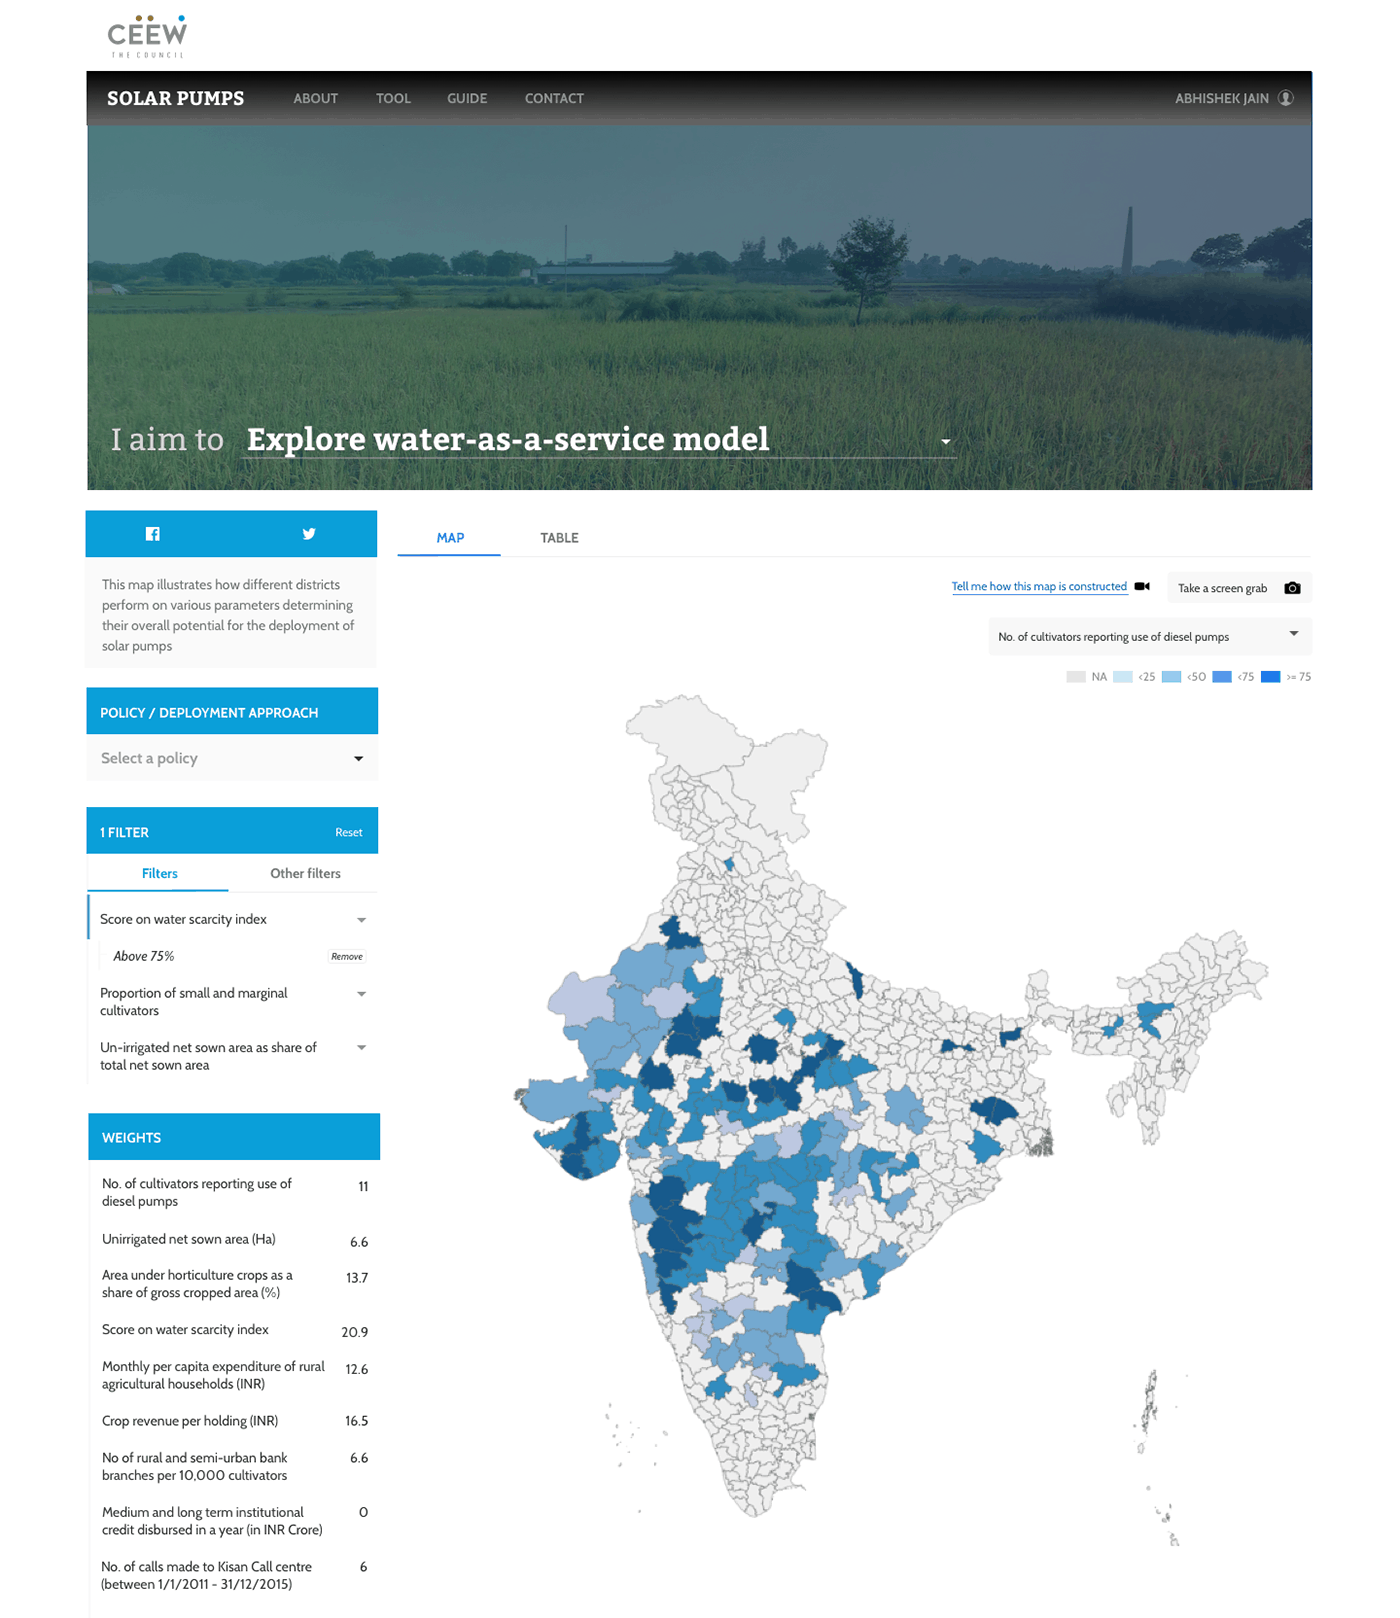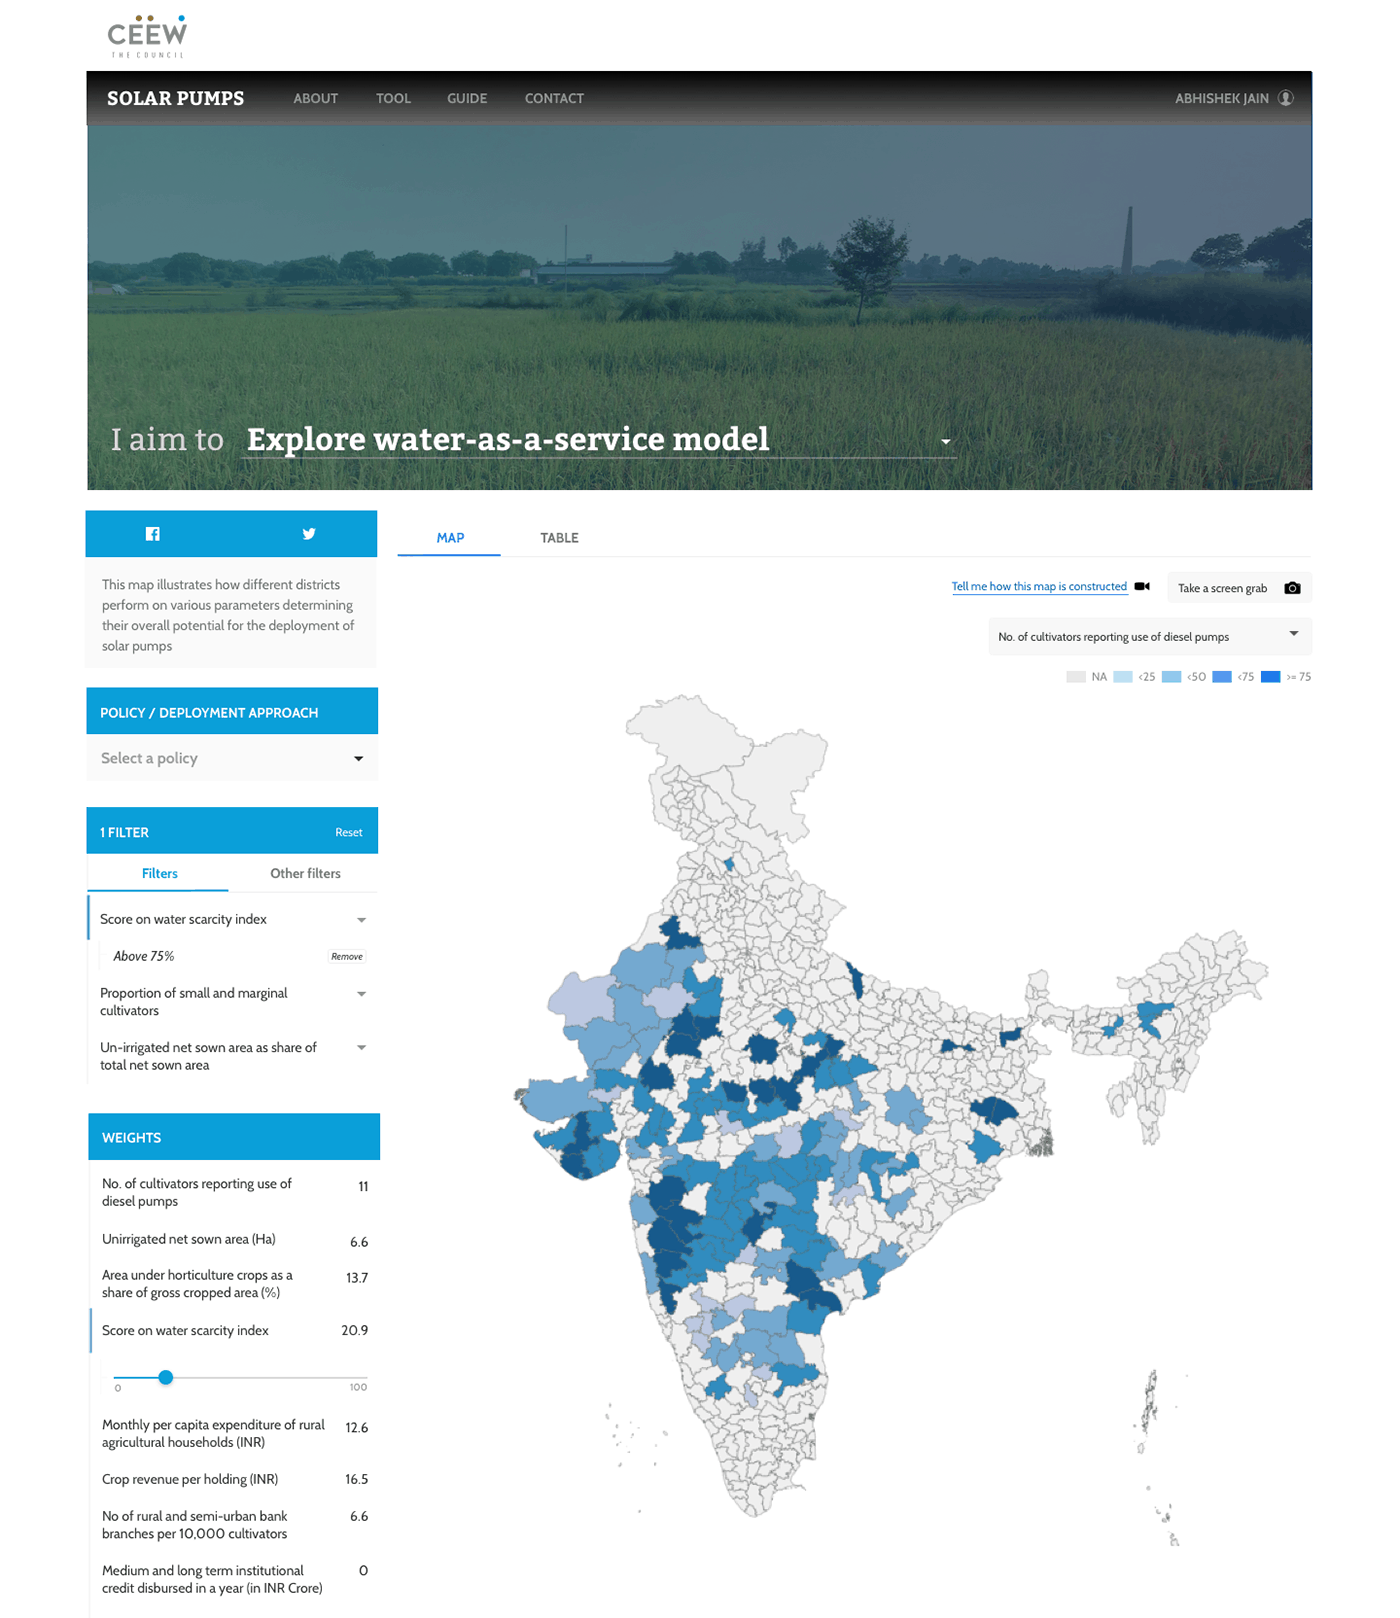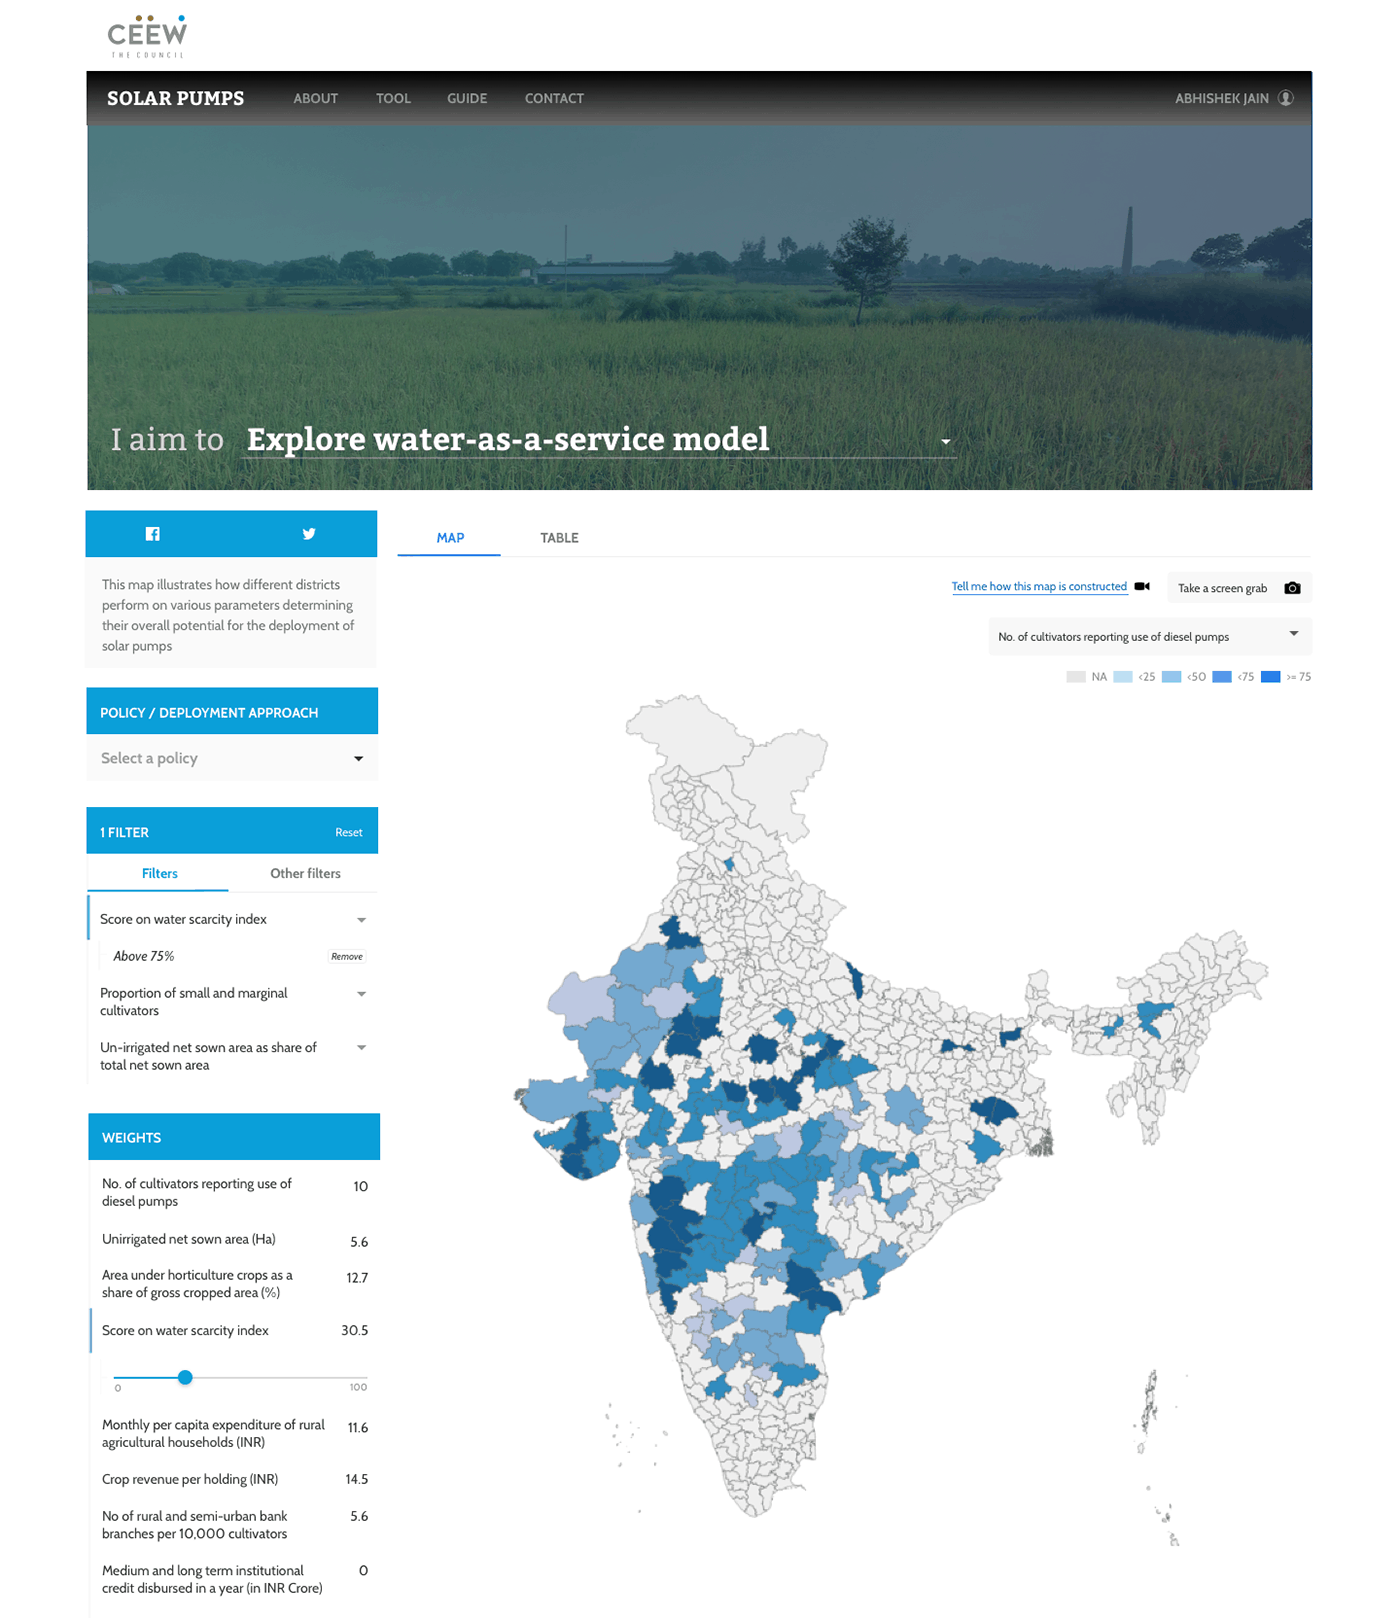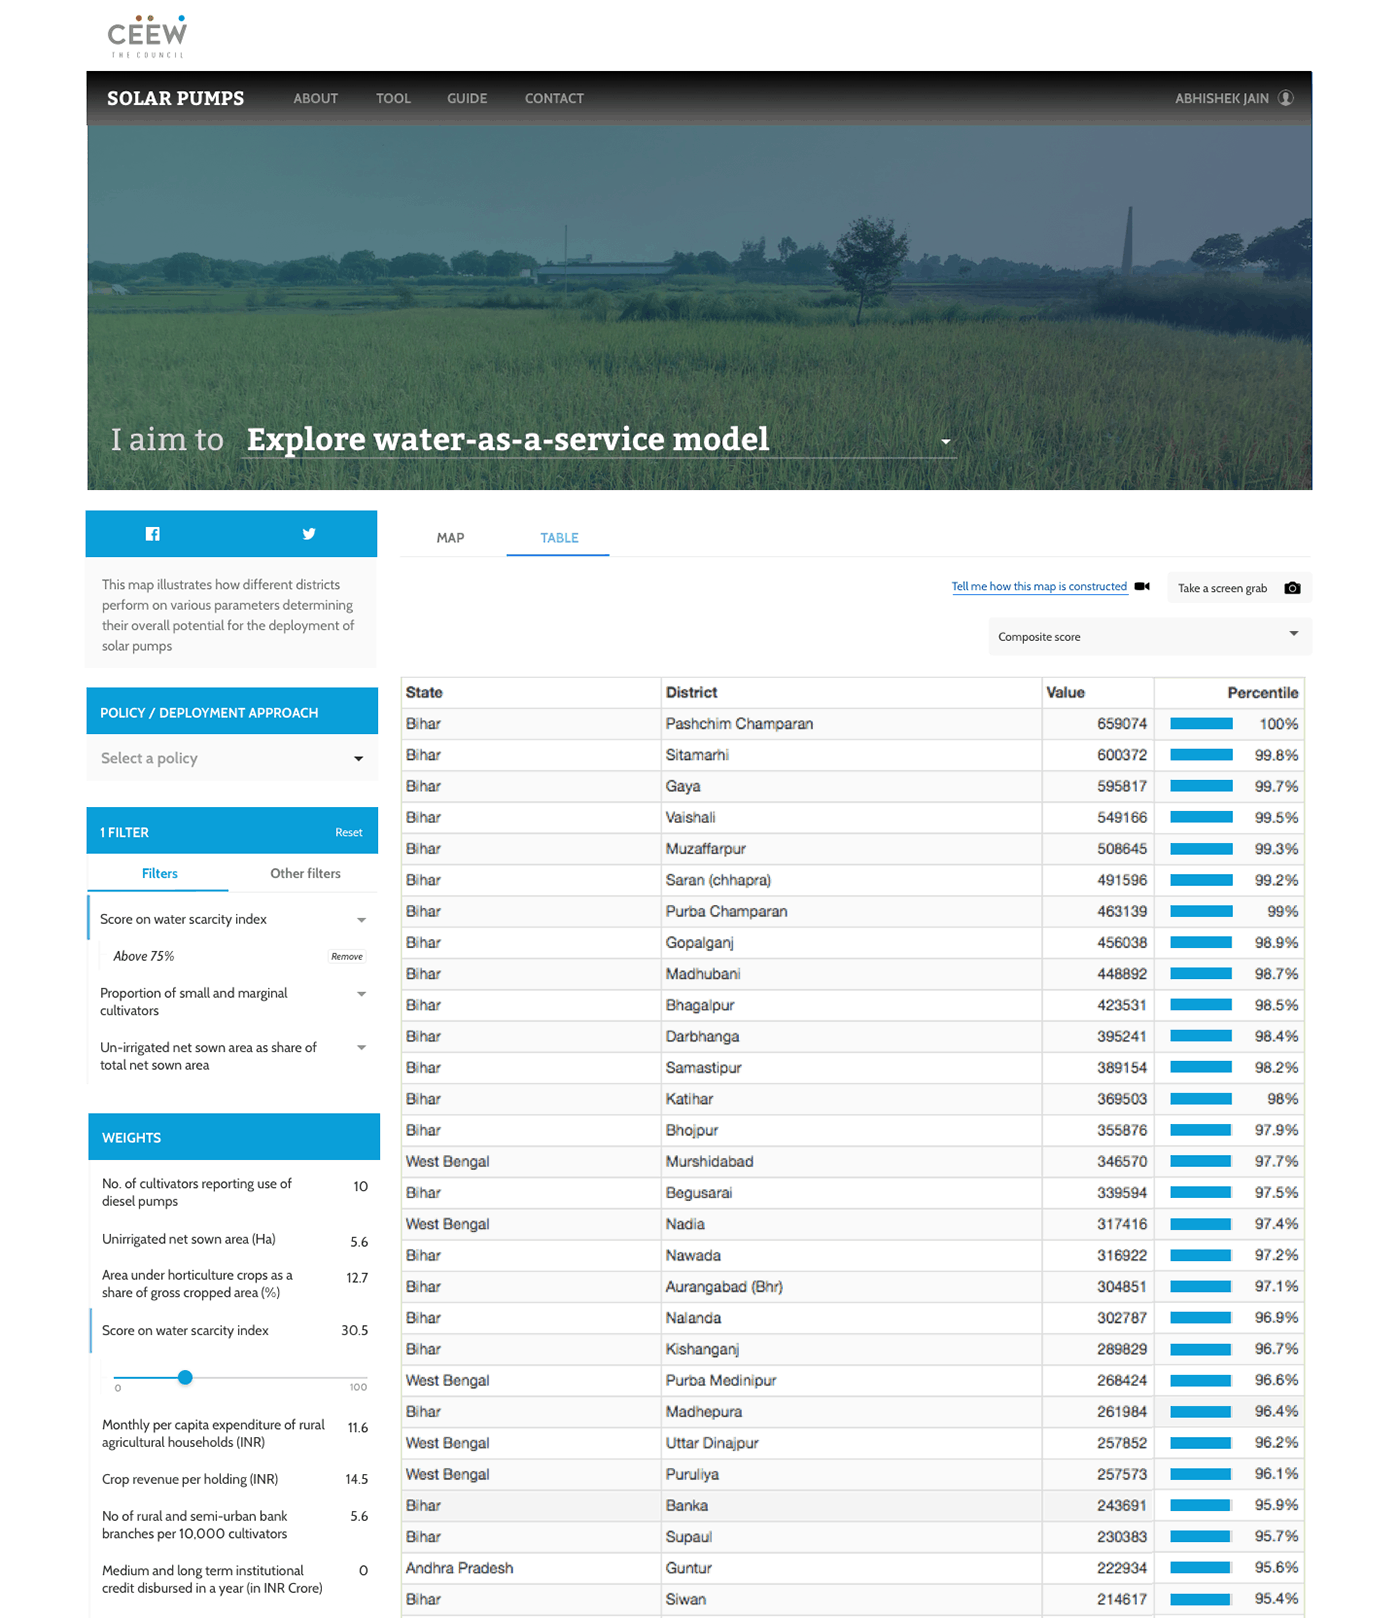
Evaluate feasibility of deploying solar pumps
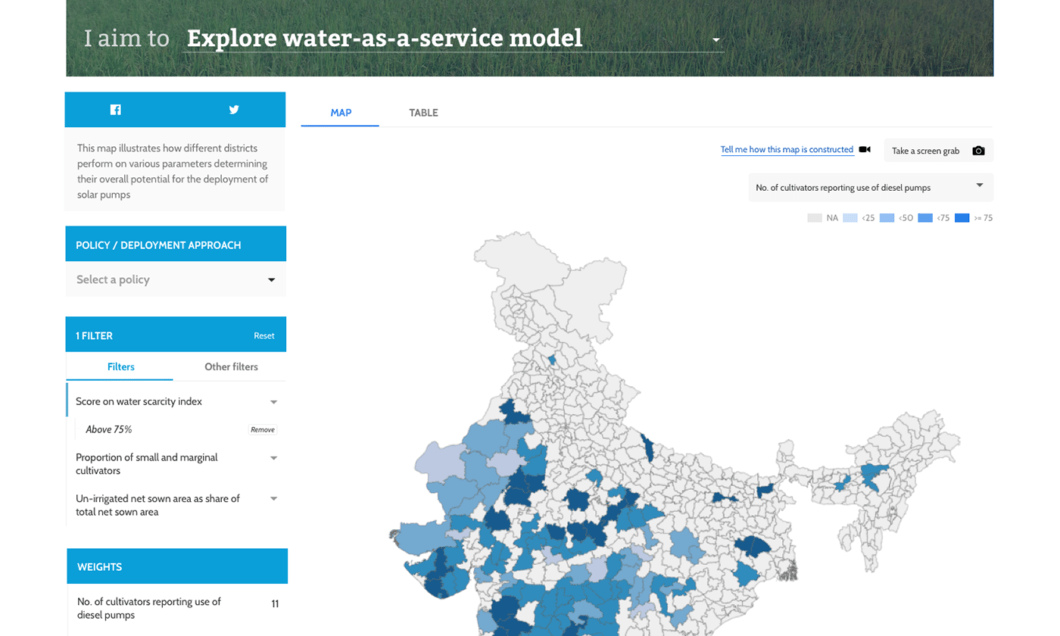
Can India irrigate itself with solar water pumps?
This project was built for CEEW (Council on Energy, Environment and Water) and GIZ.de. The final product is live at https://portal.ceew.in
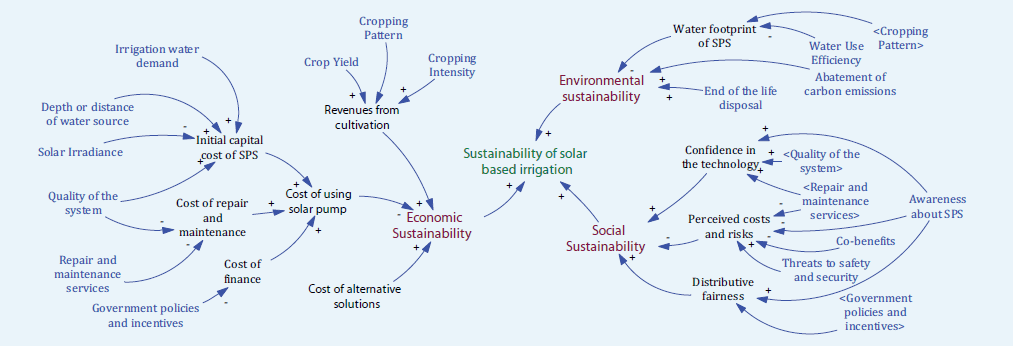
pykih was tasked with converting this model into a decision support tool.
Audience
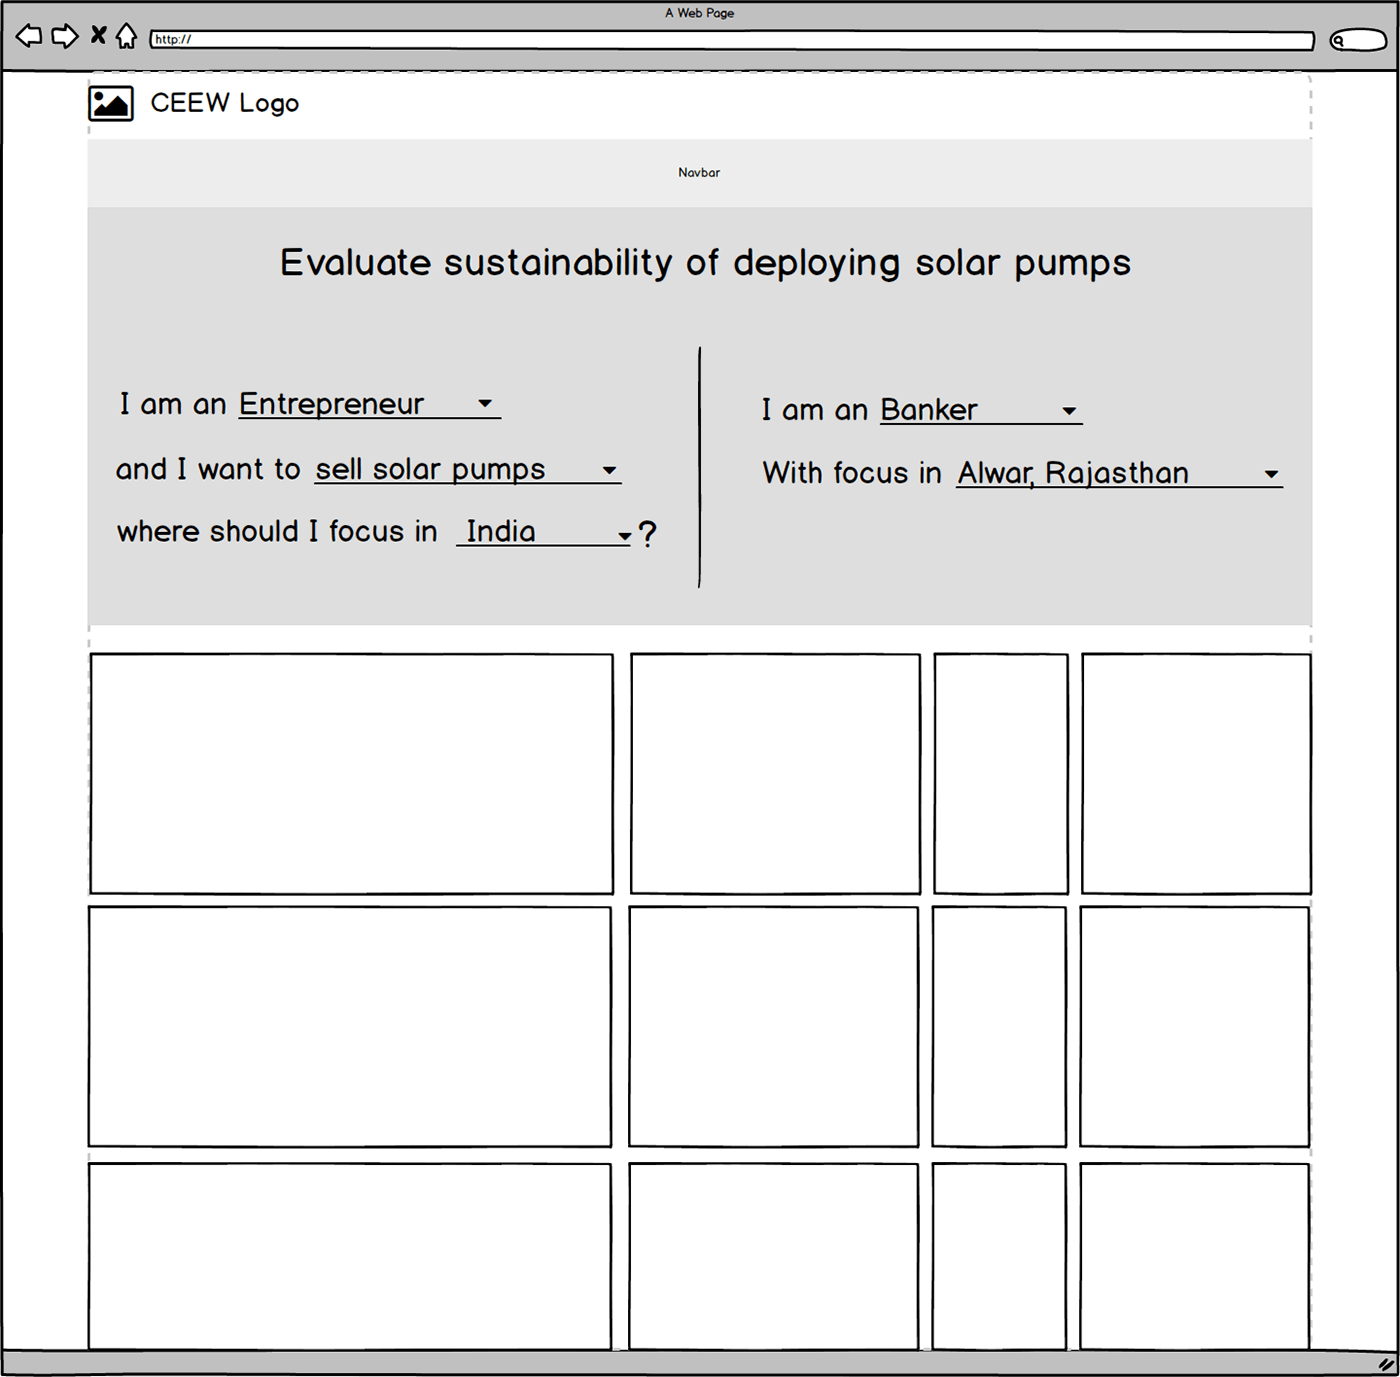
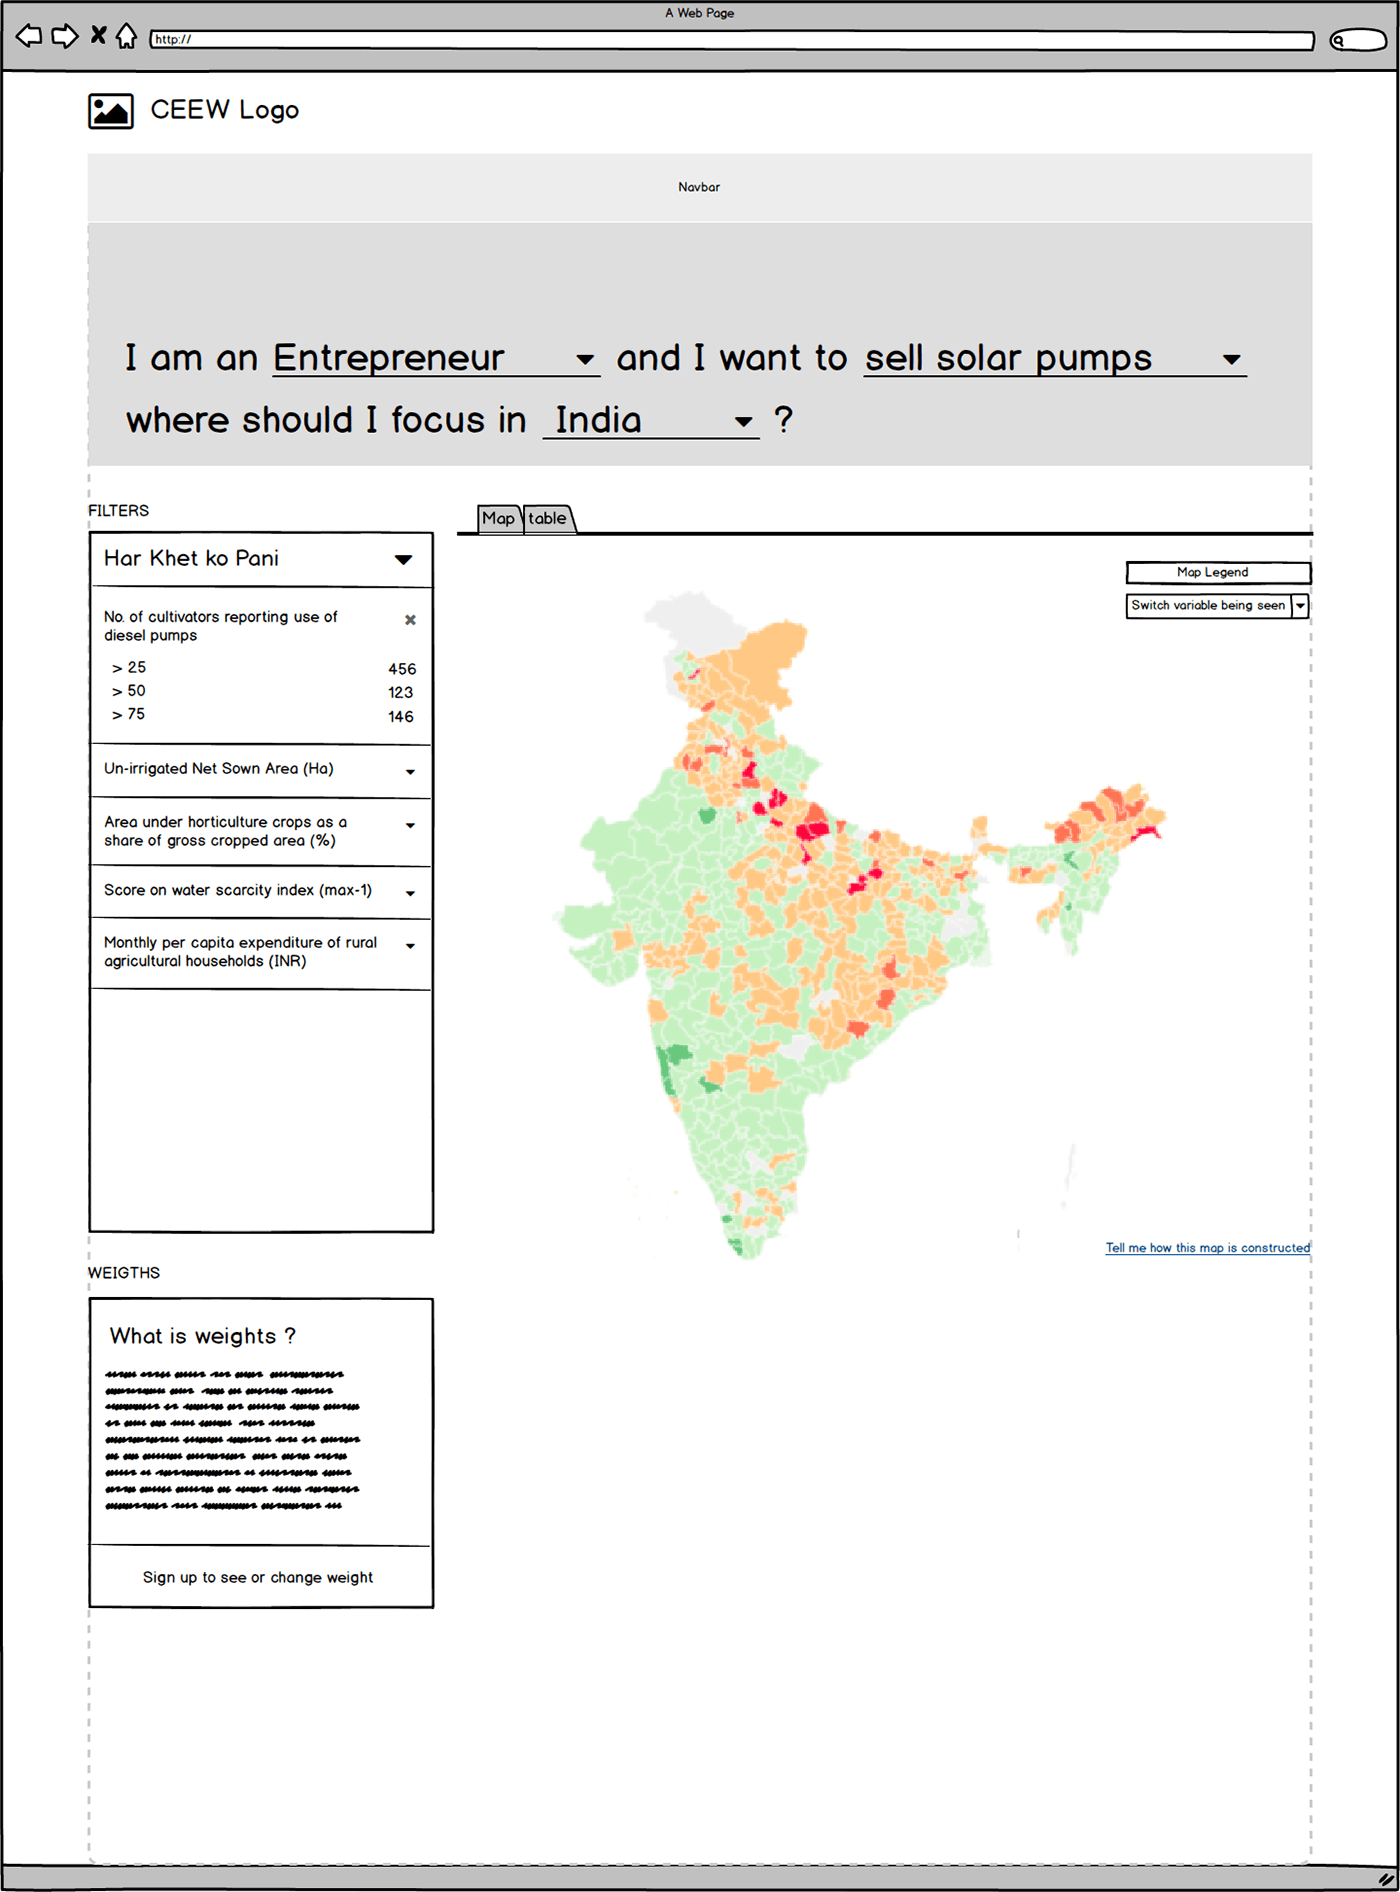
Central Government policy makers can use this tool it to evaluate where (in which specific regions) should they encourage or discourage solar pumps.
IAS officers (Indian Administrative Services) can use this to determine how best to deploy solar pumps in their specific district.
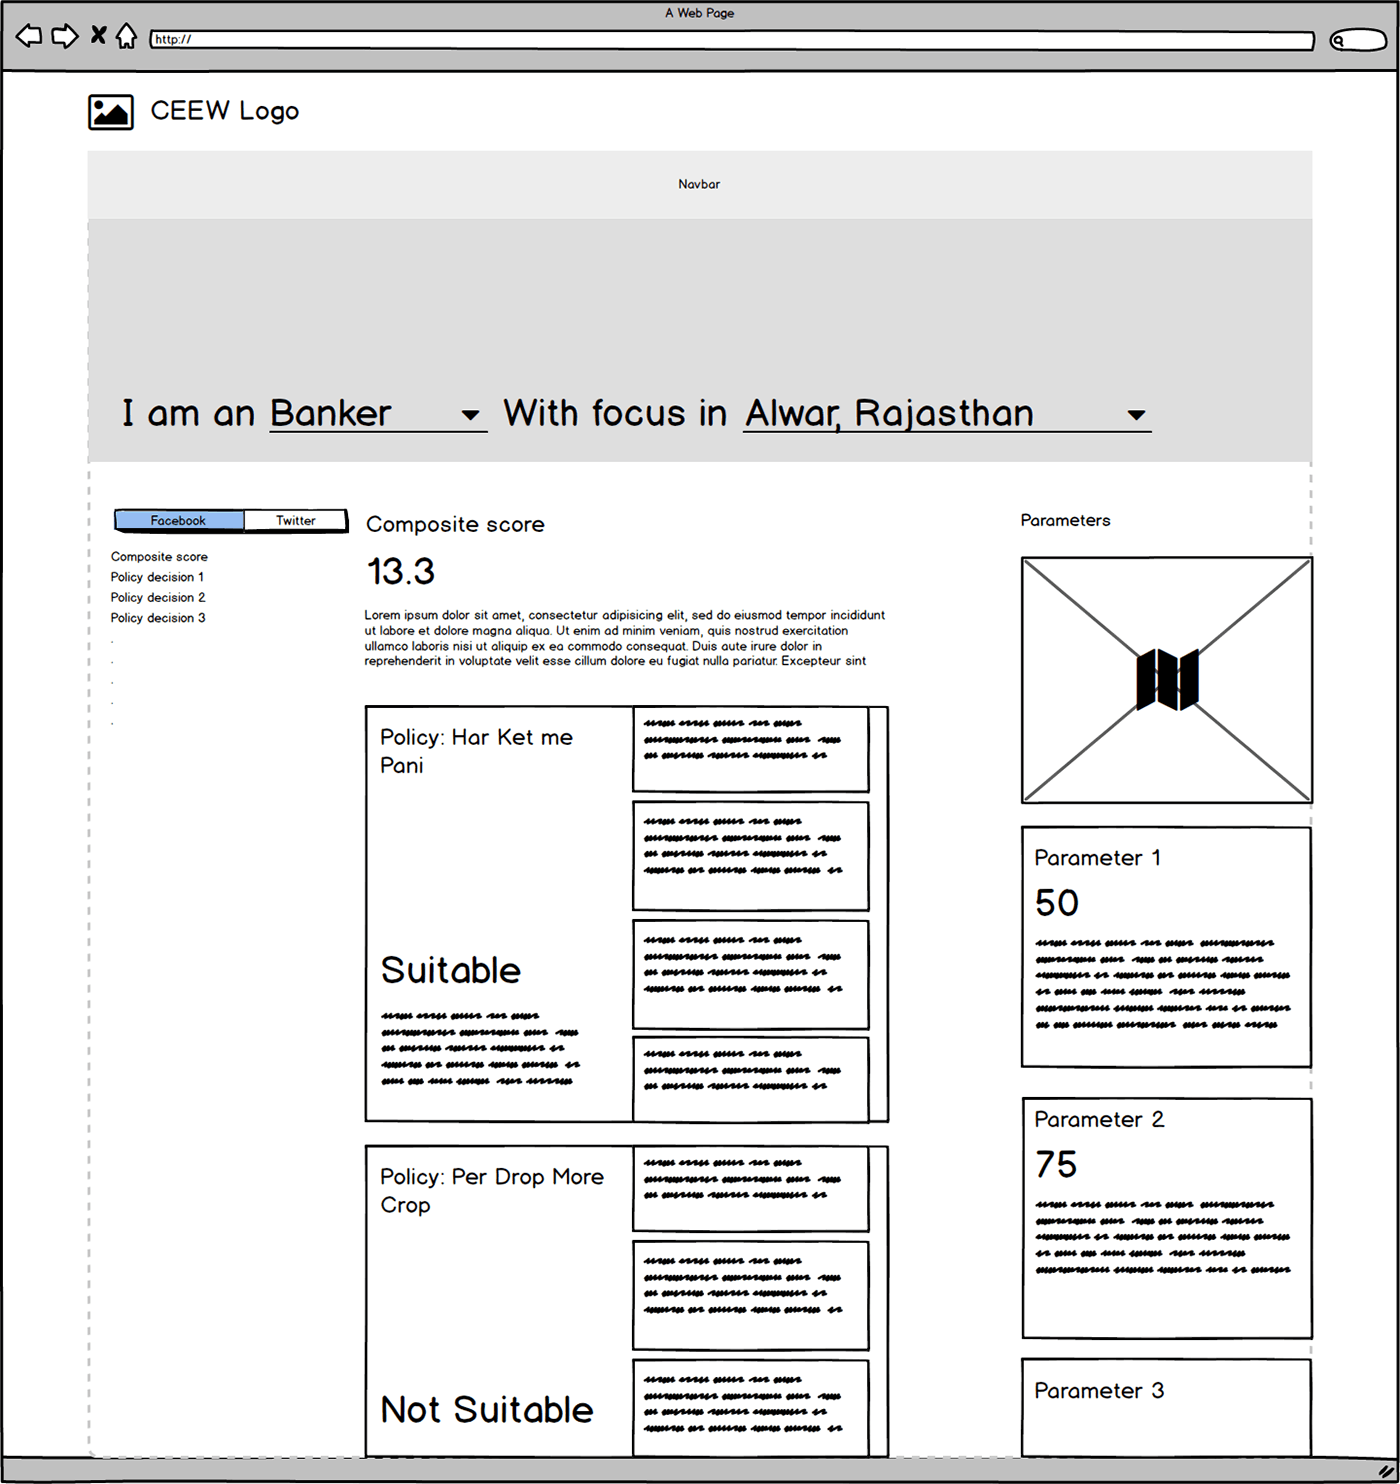
Public sector banks in India are mandated to loan a certain percentage of their corpus to farmers. They can use this tool to evaluate credit worthiness of loan applications for solar pump.
Entrepreneurs selling solar products could determine which markets to focus on.
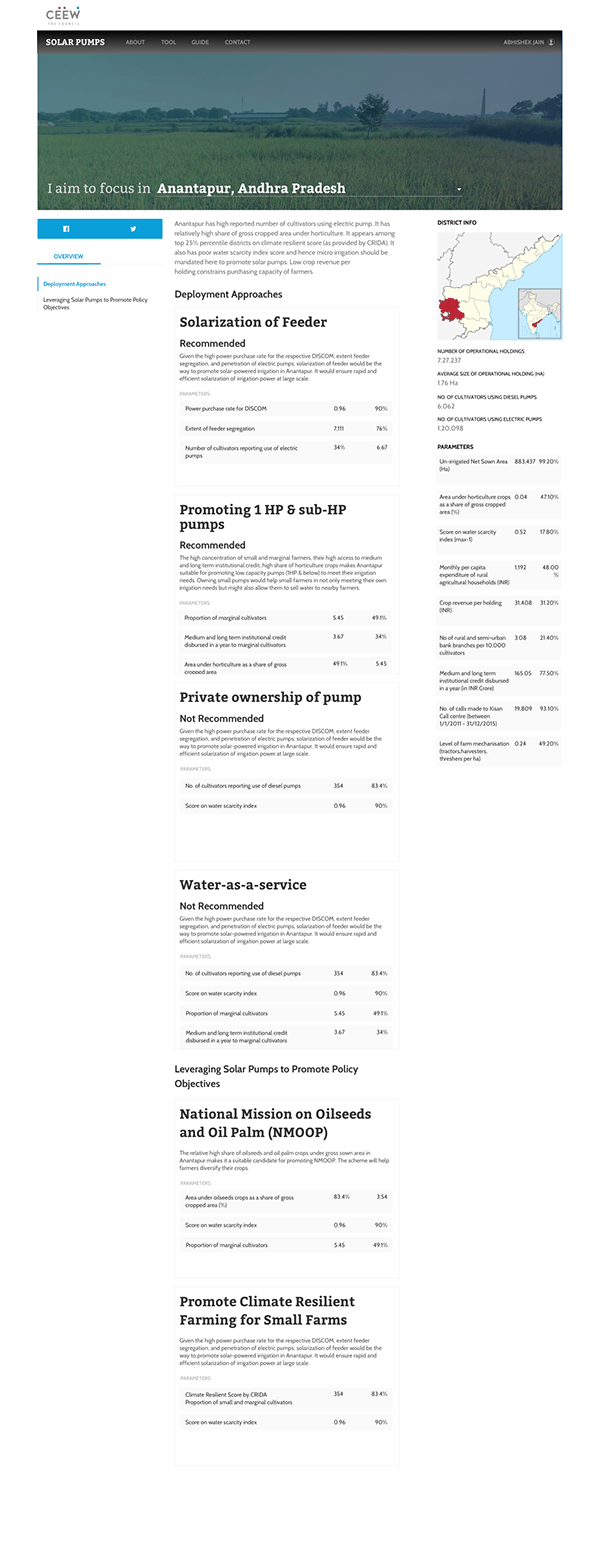
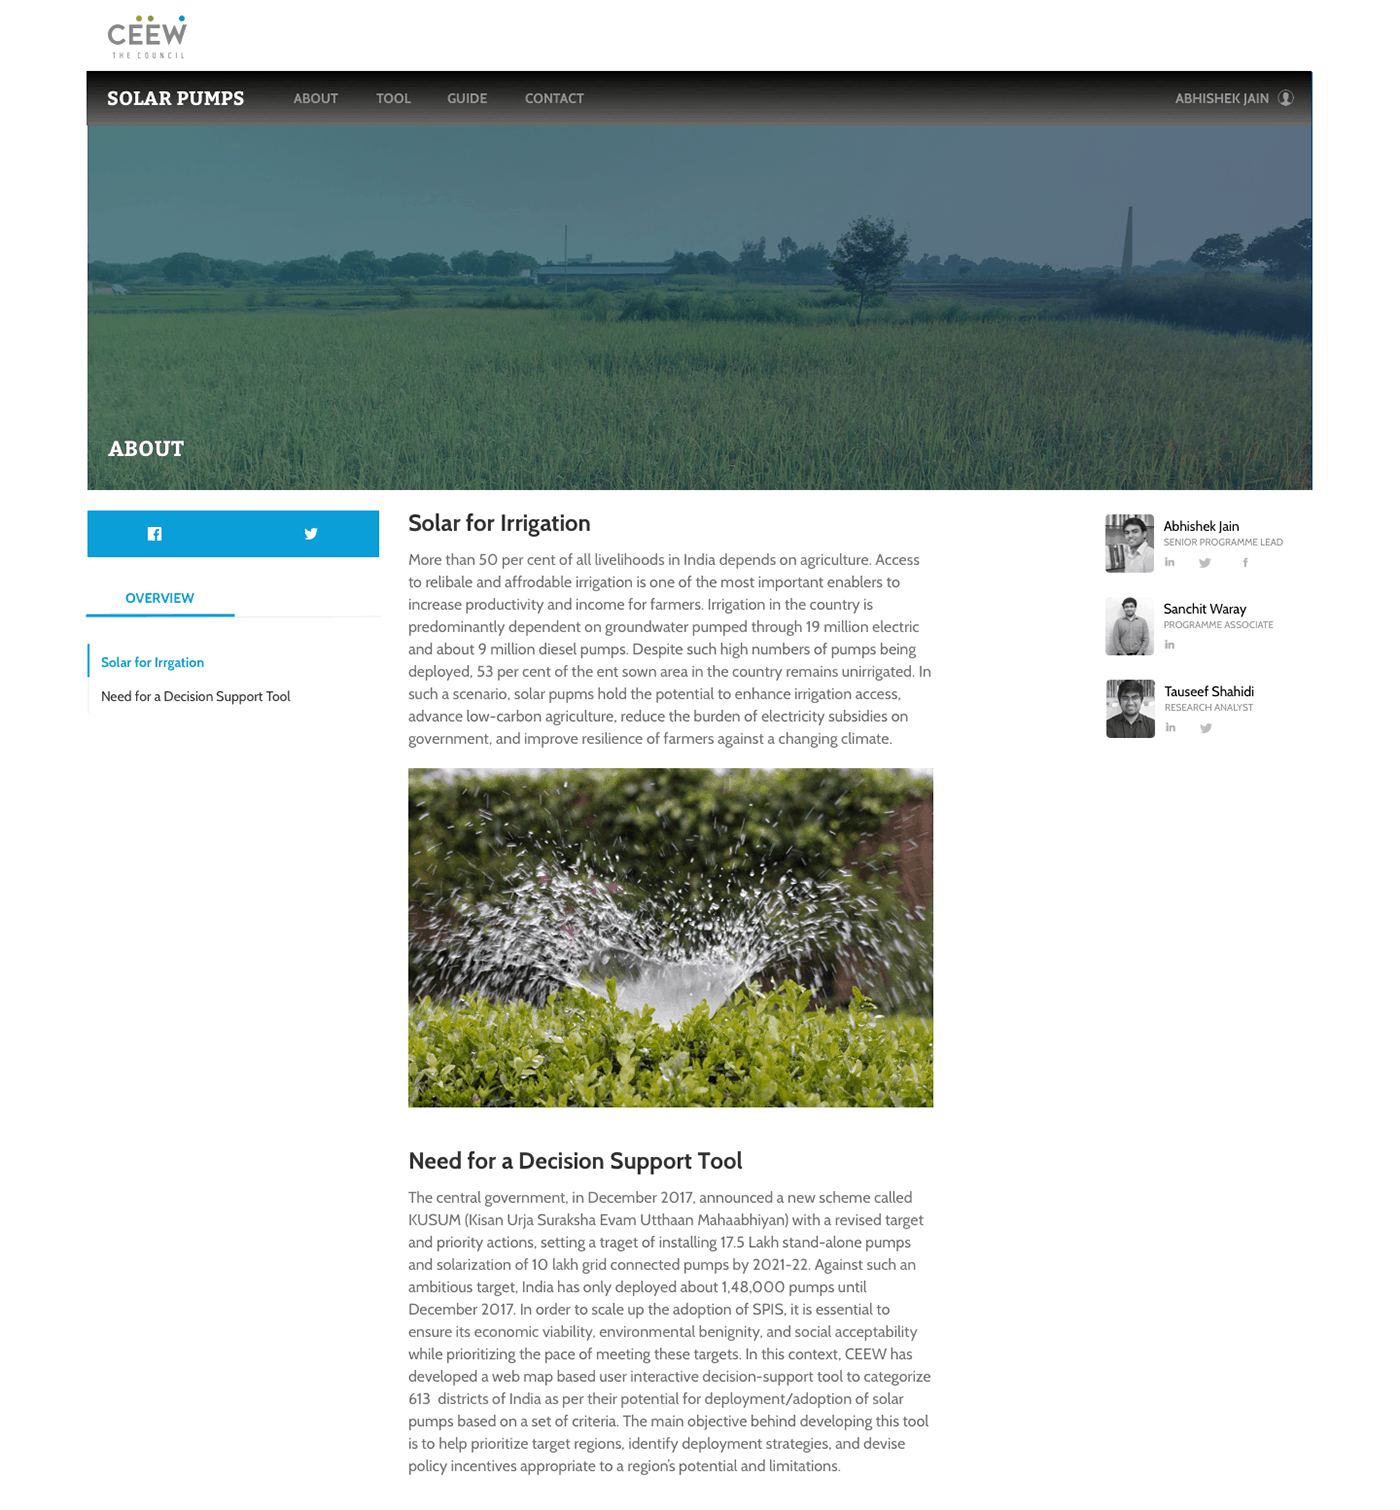
Wireframes
Mockups
Tests
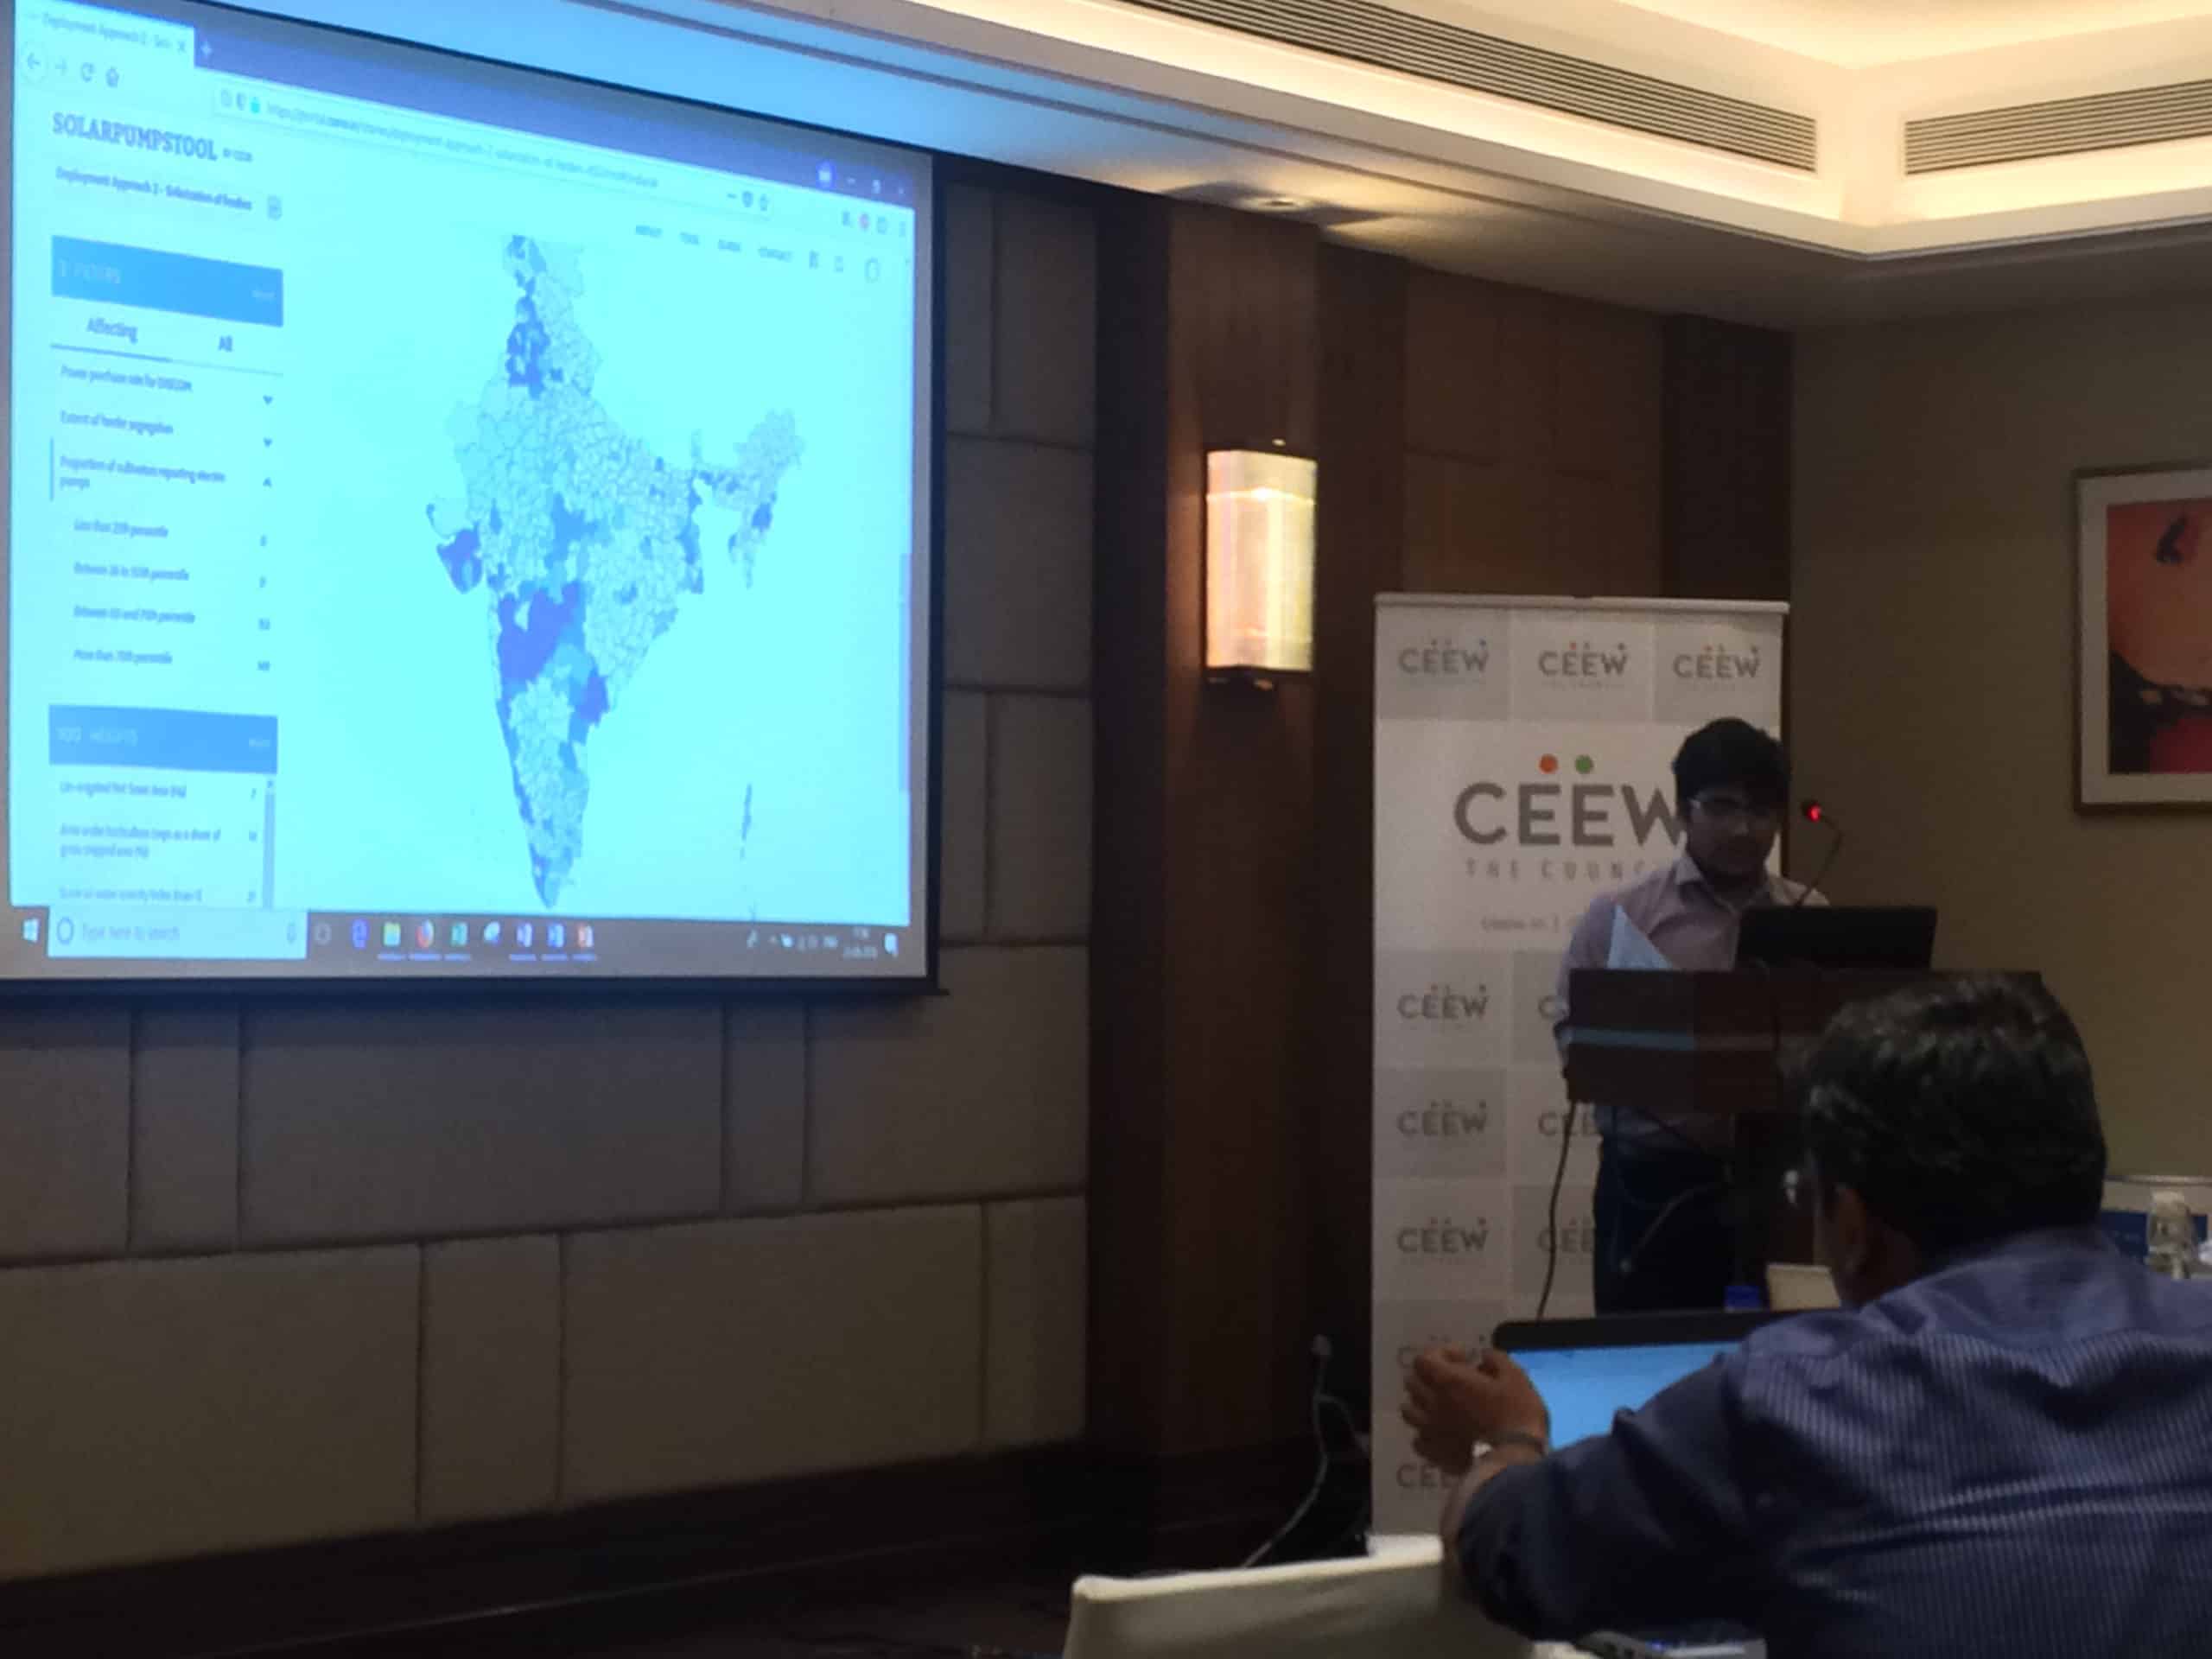
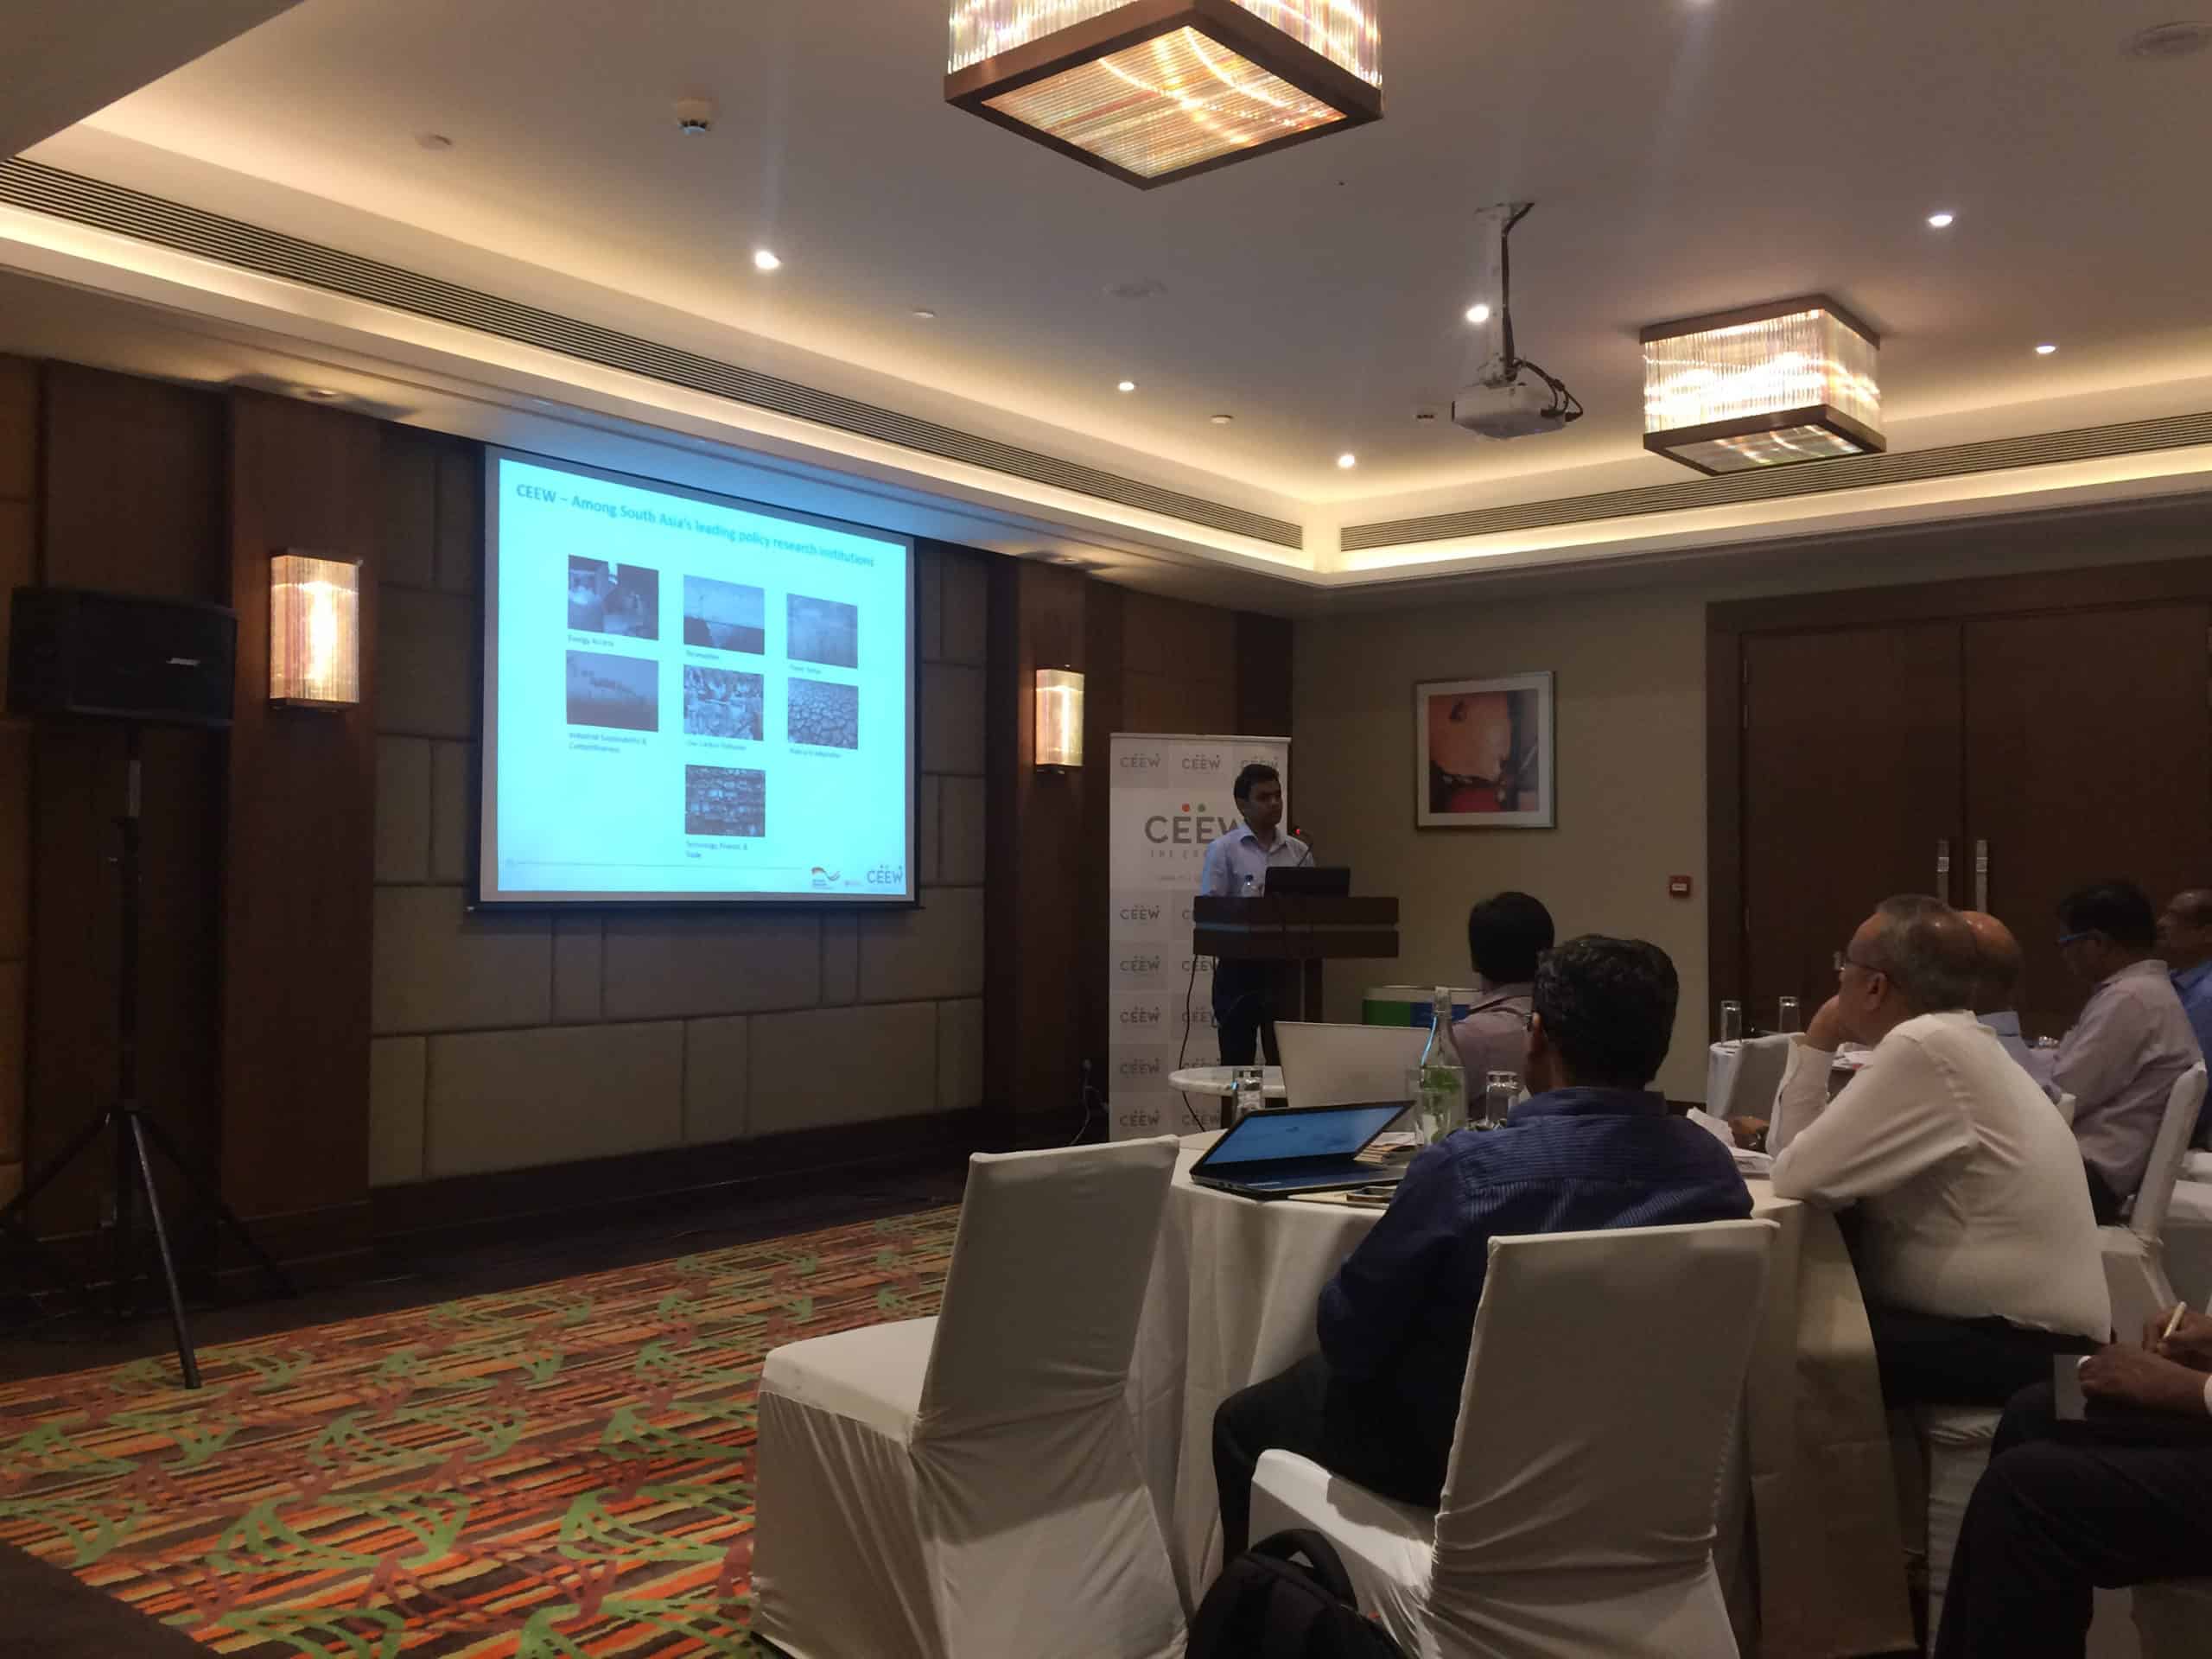
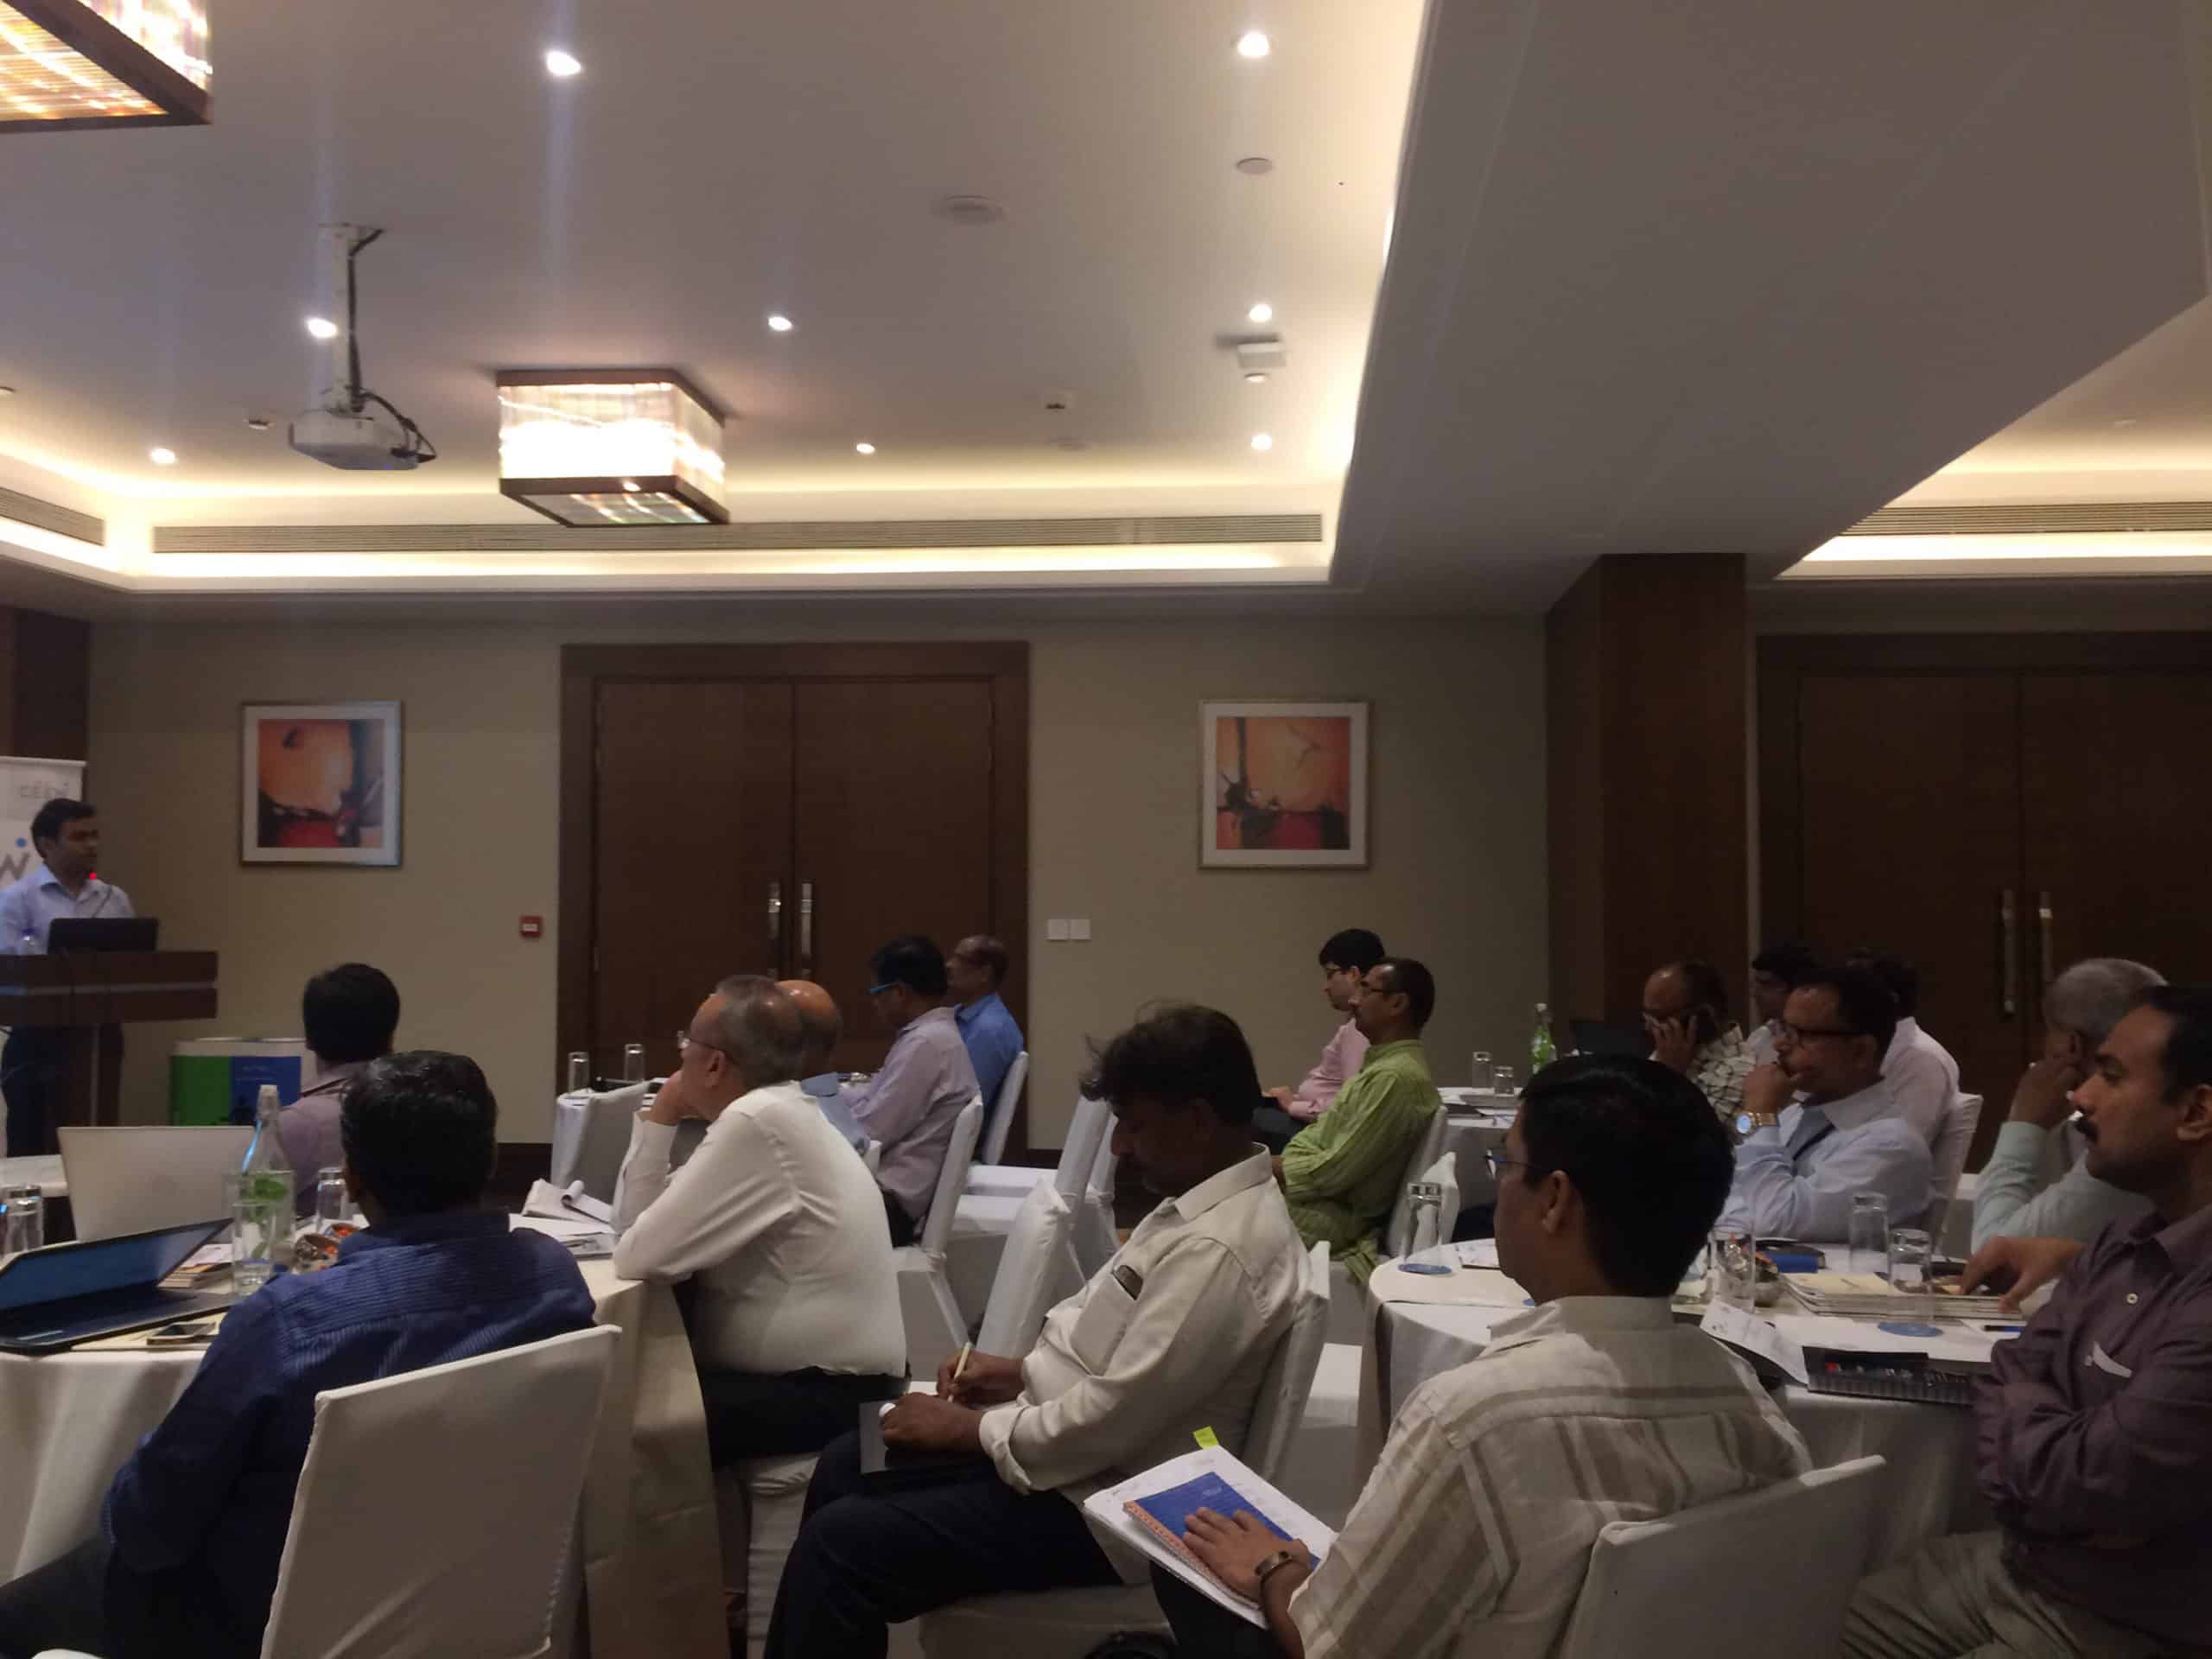
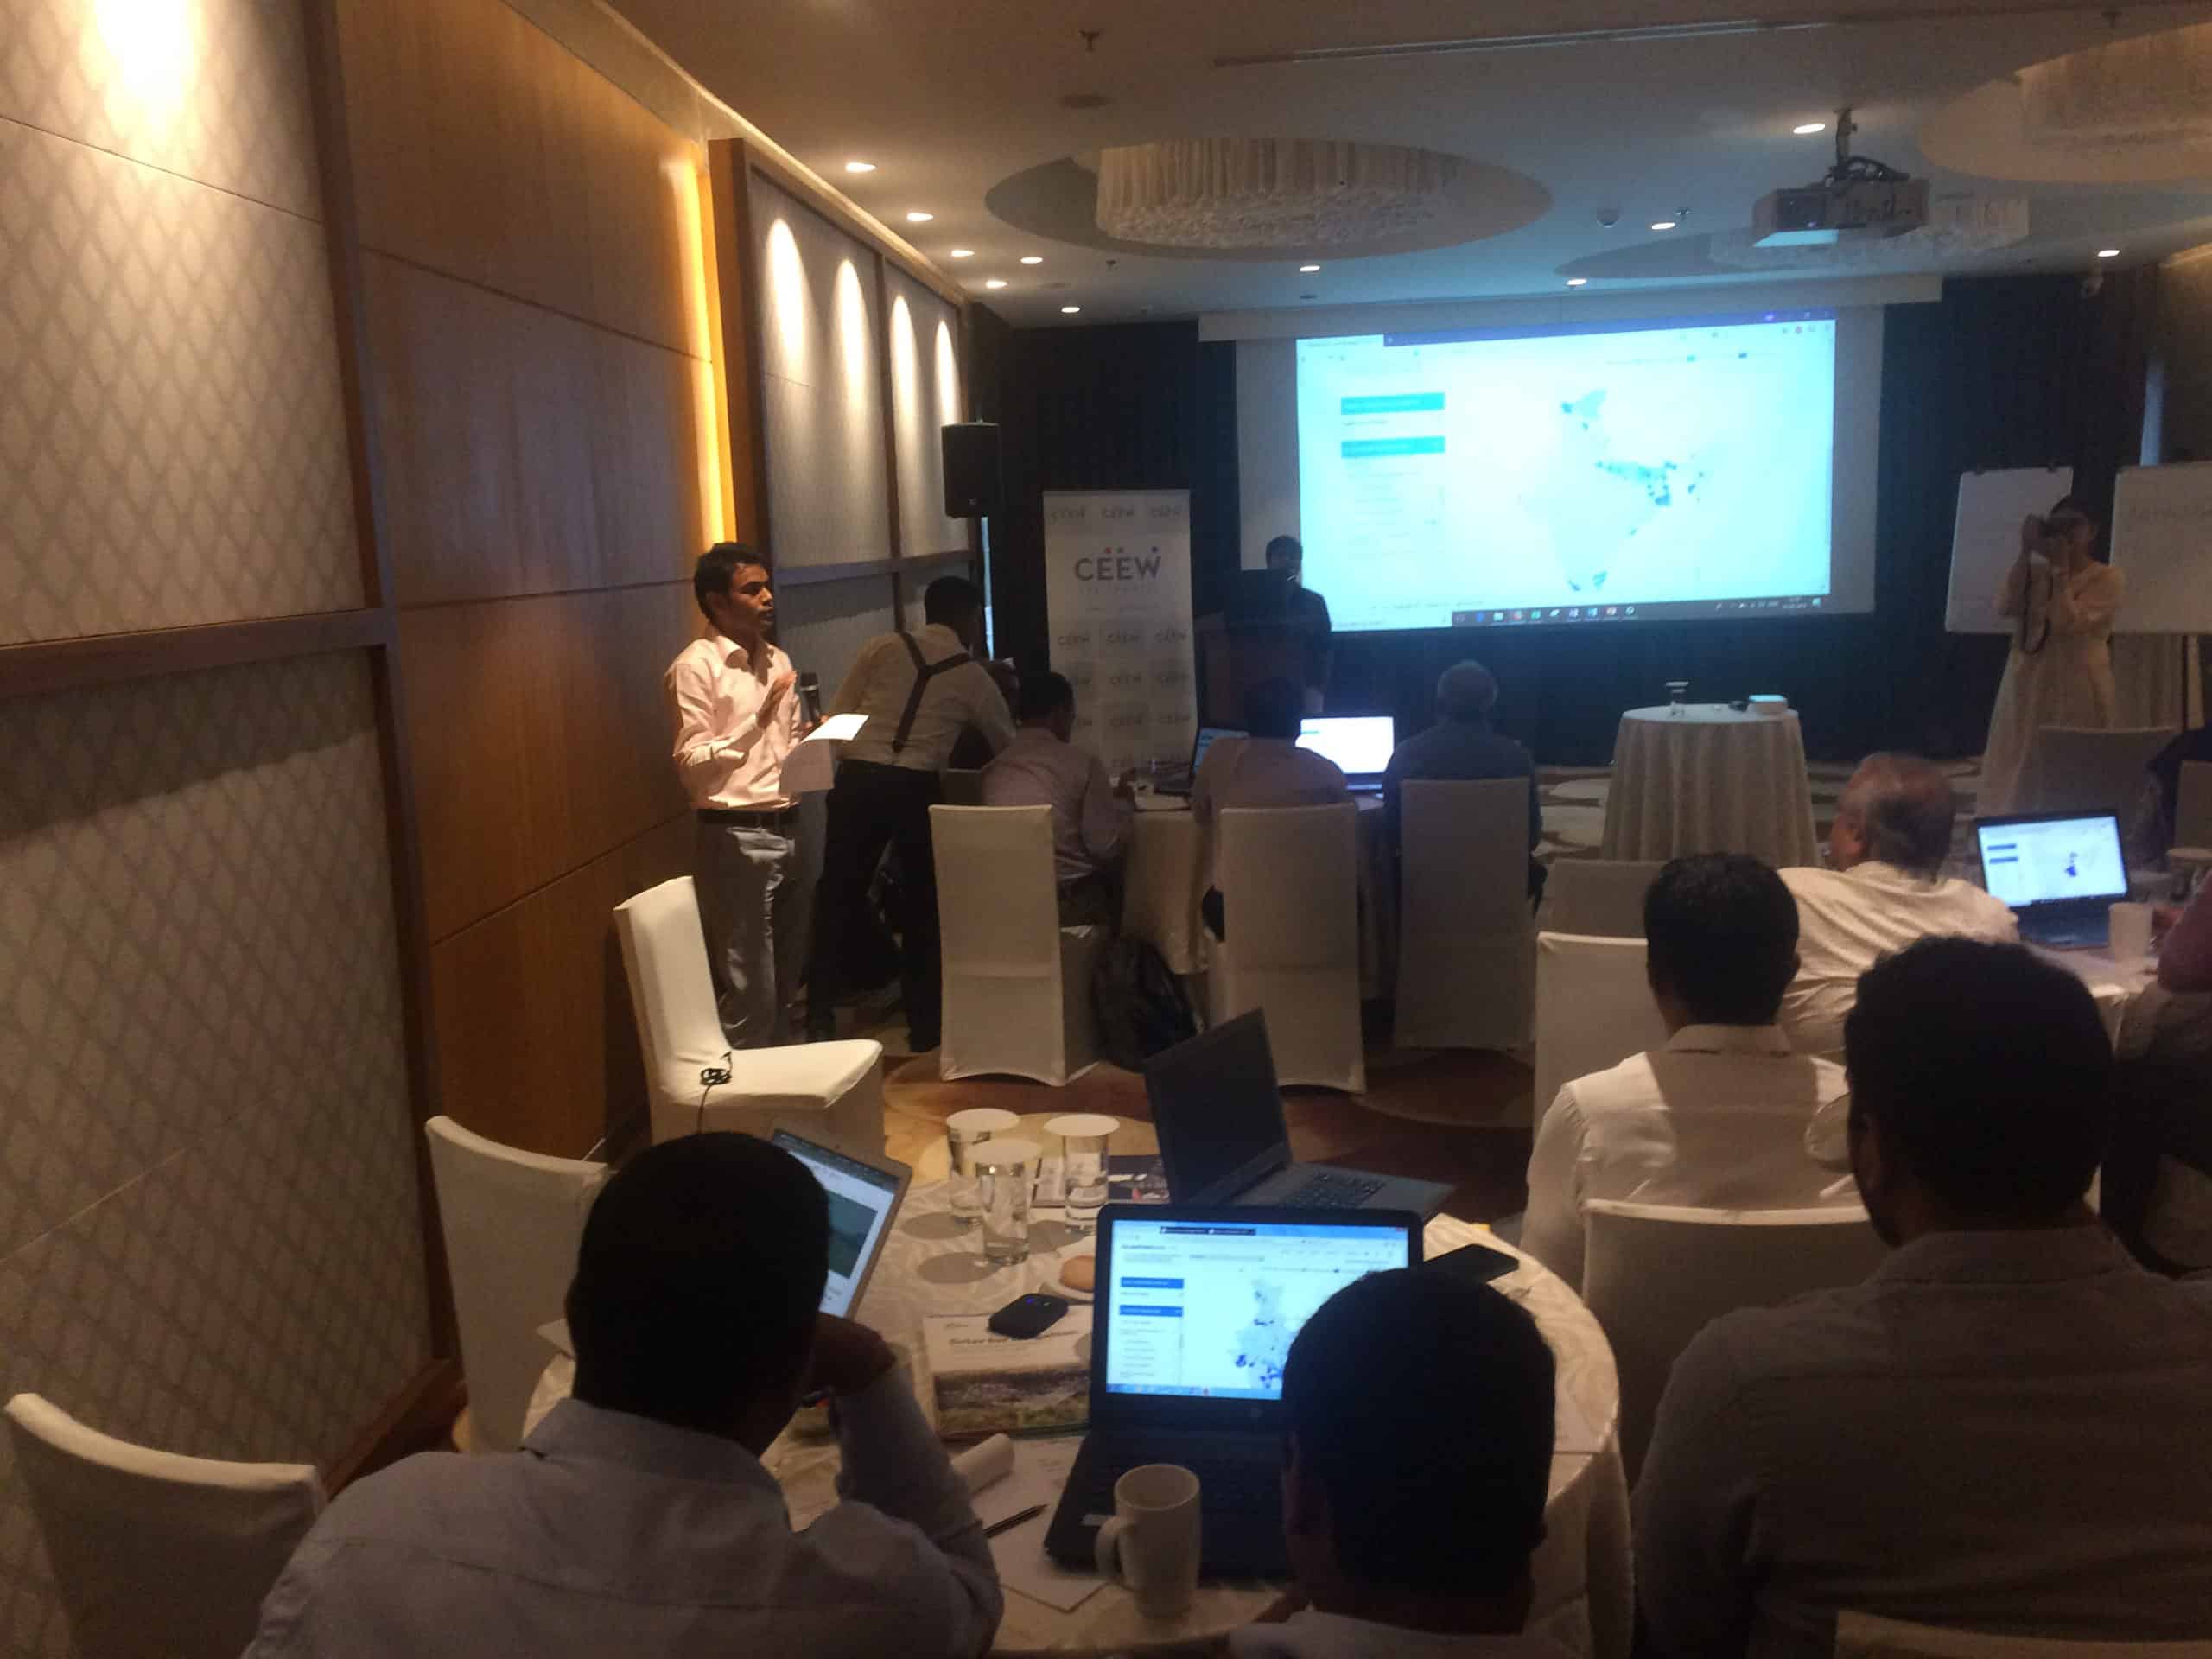
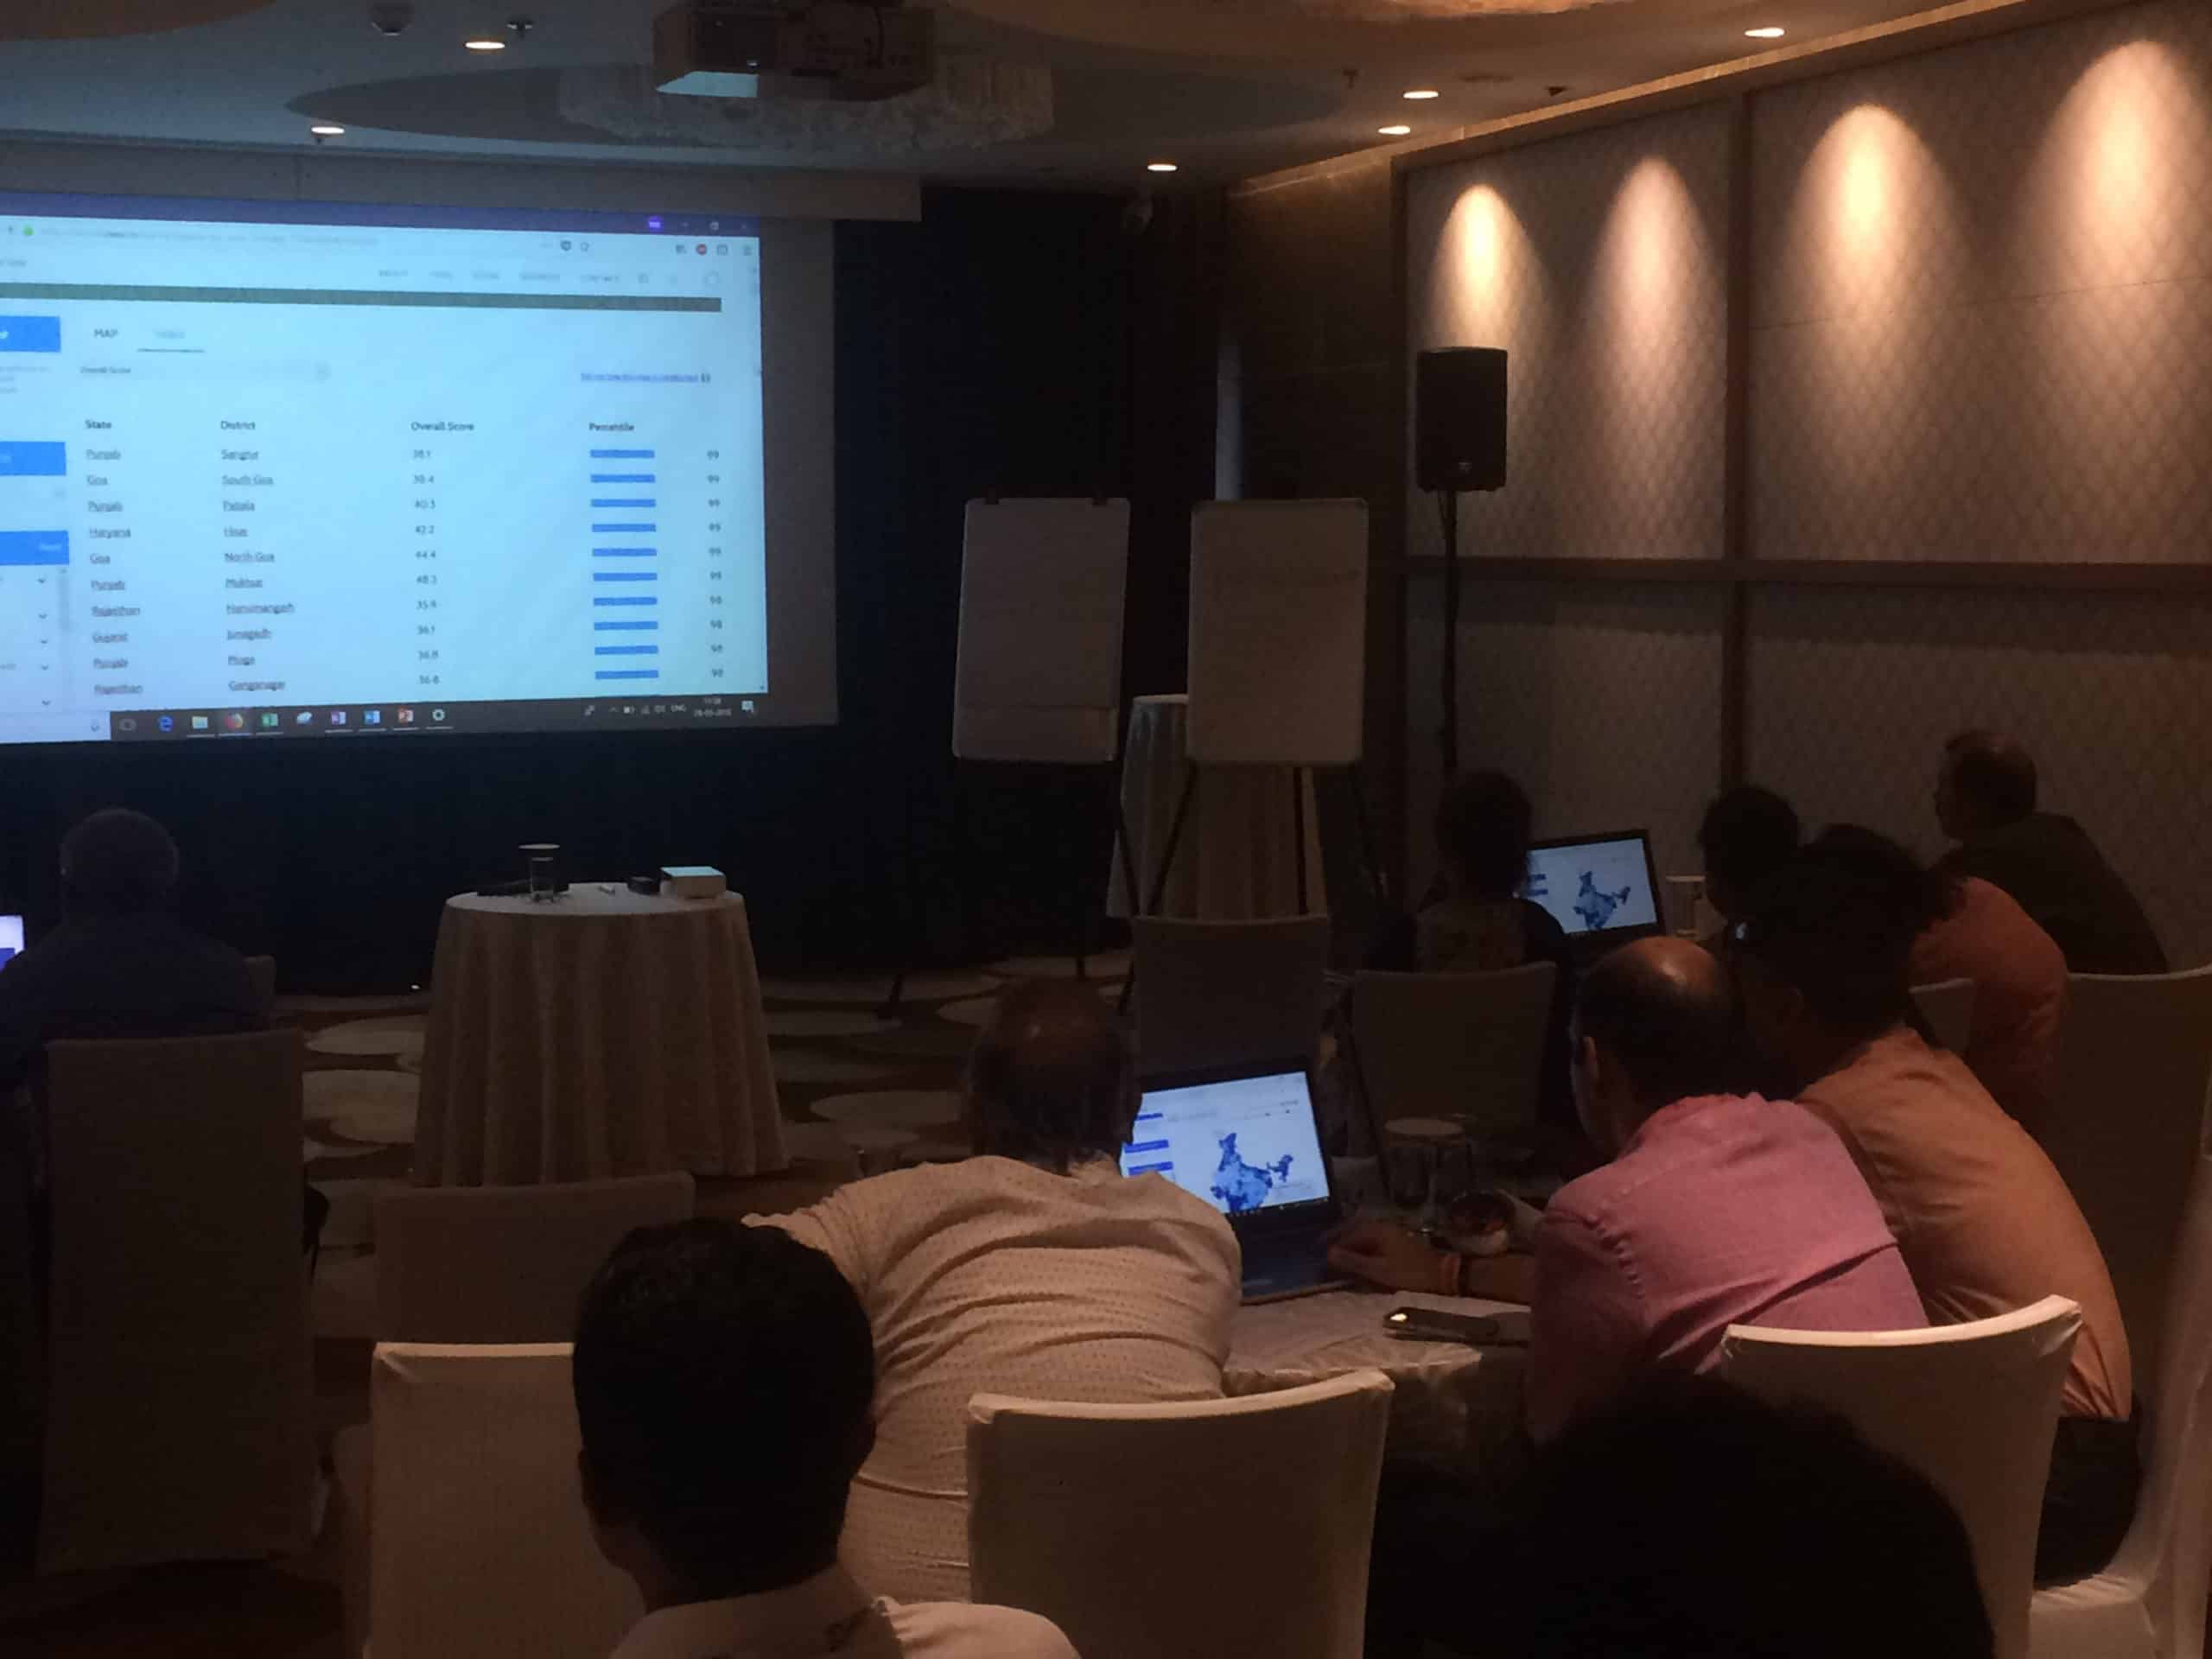
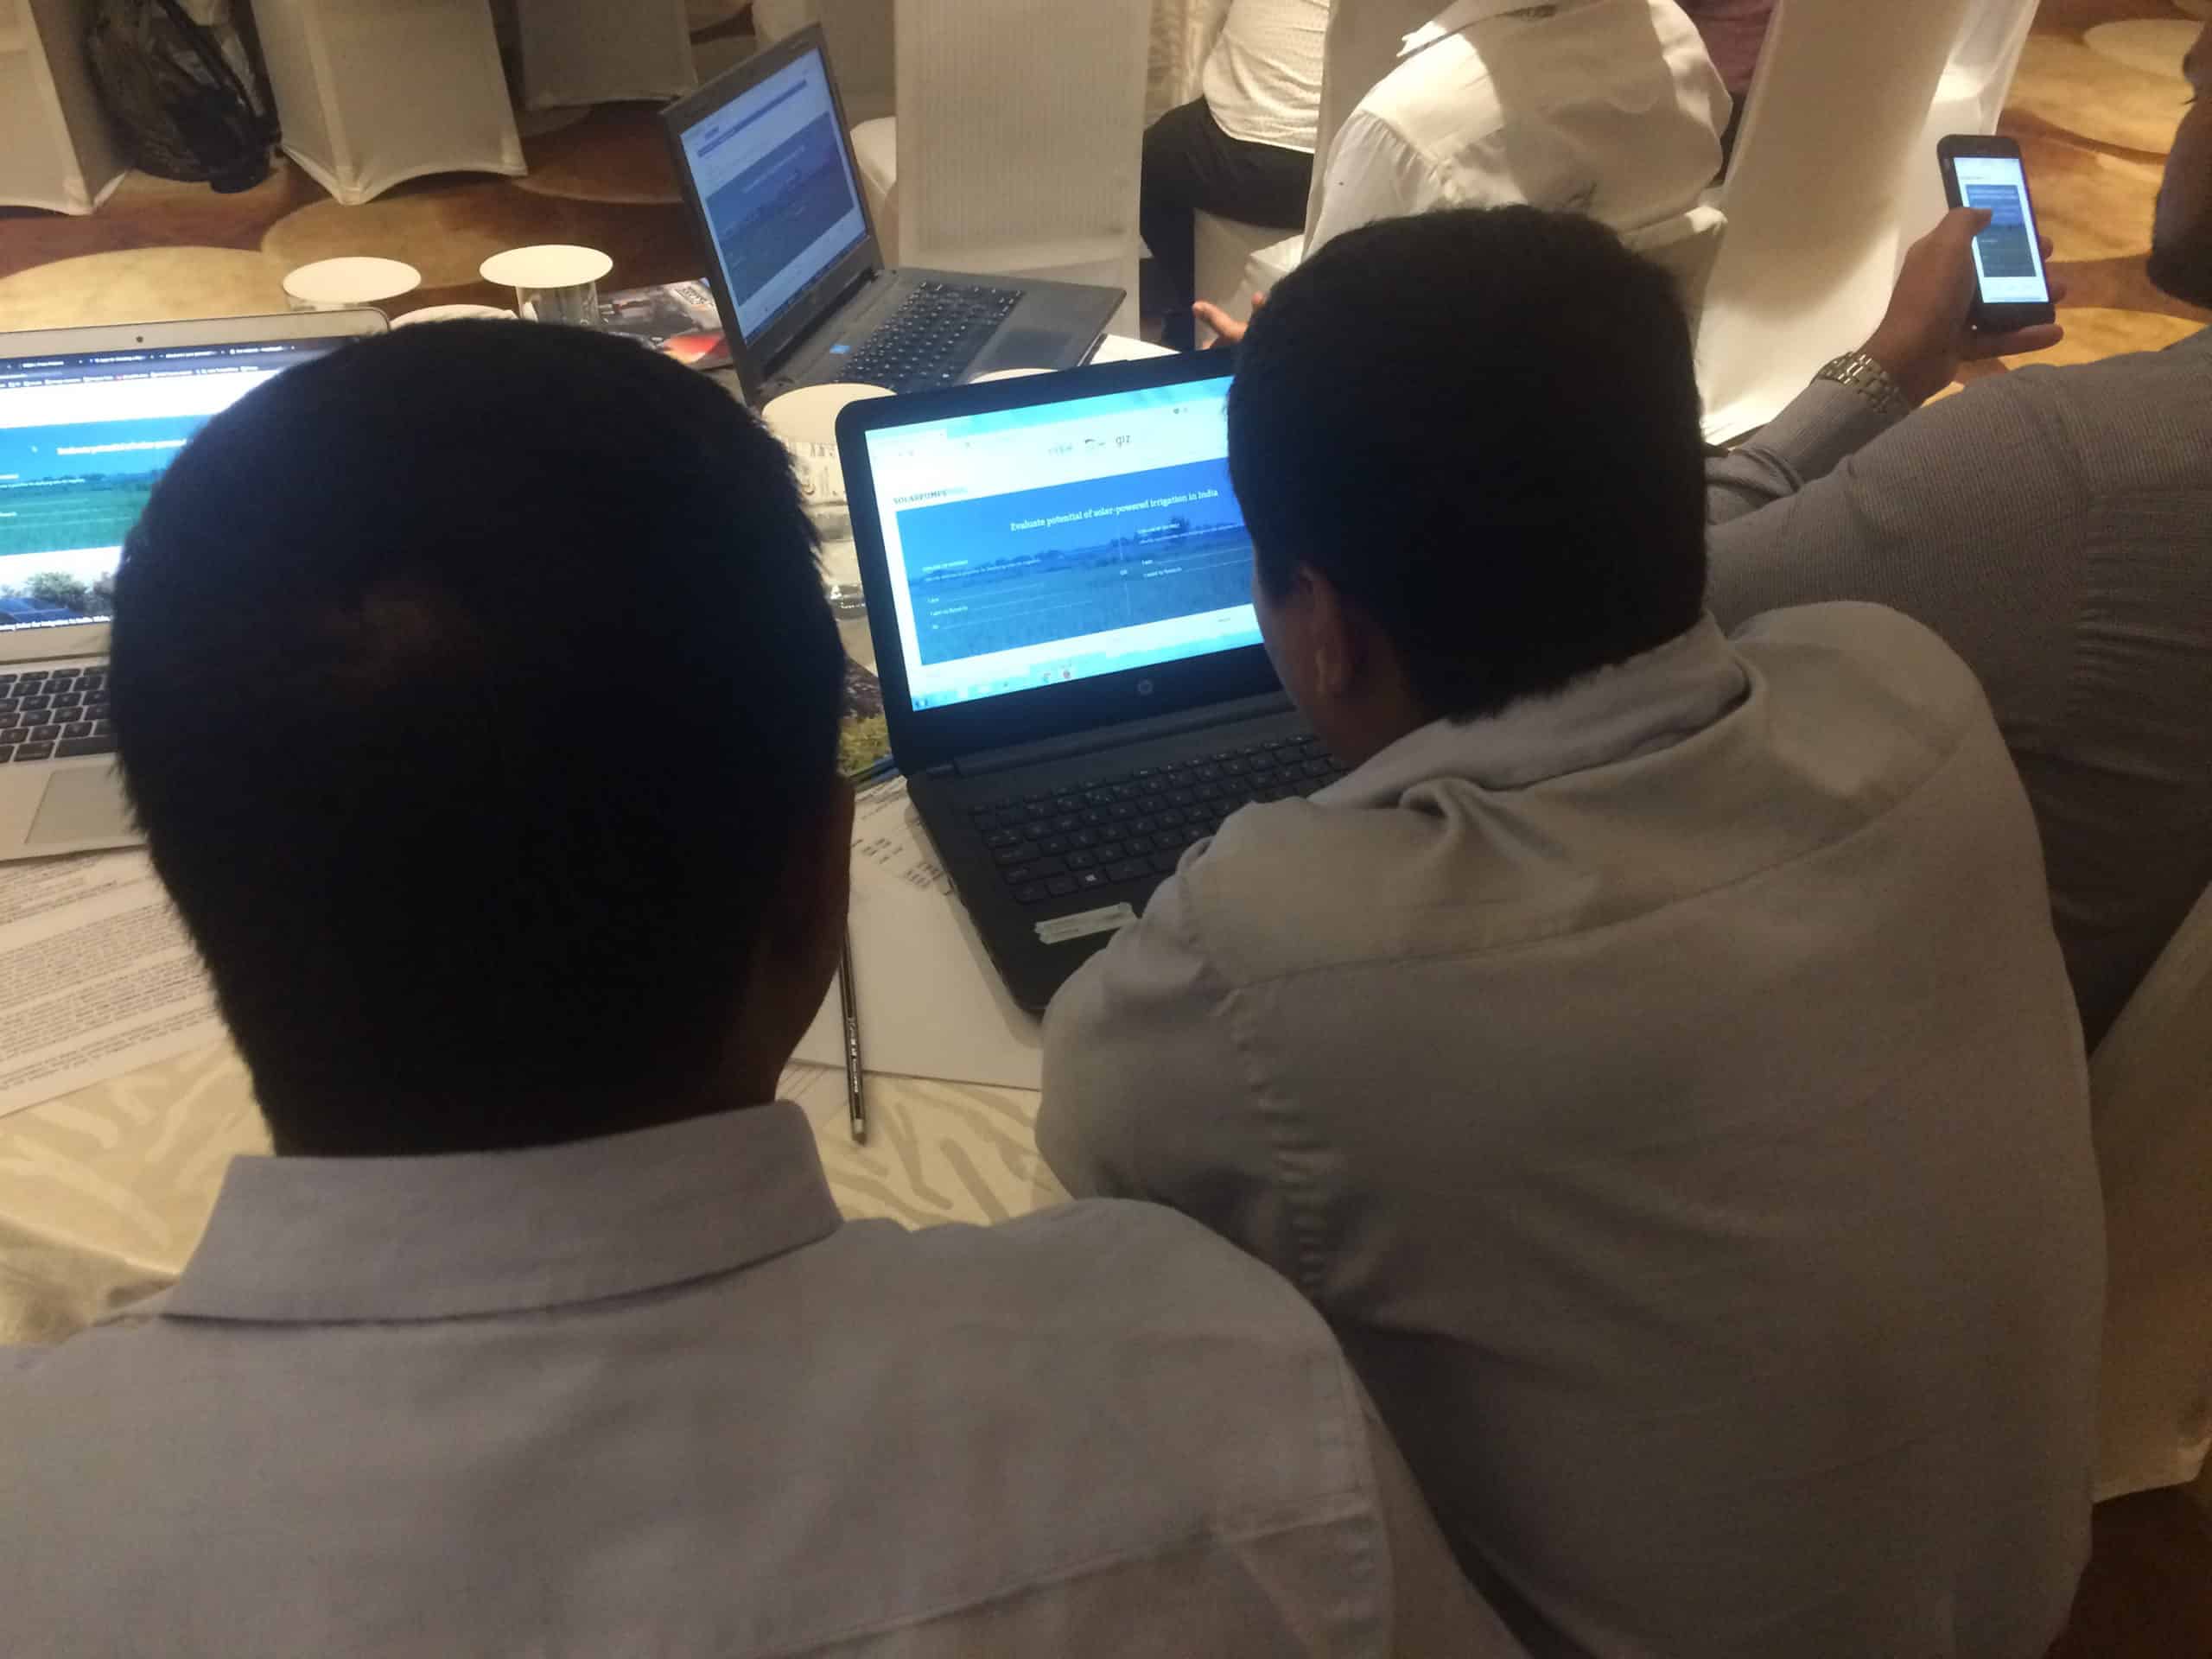
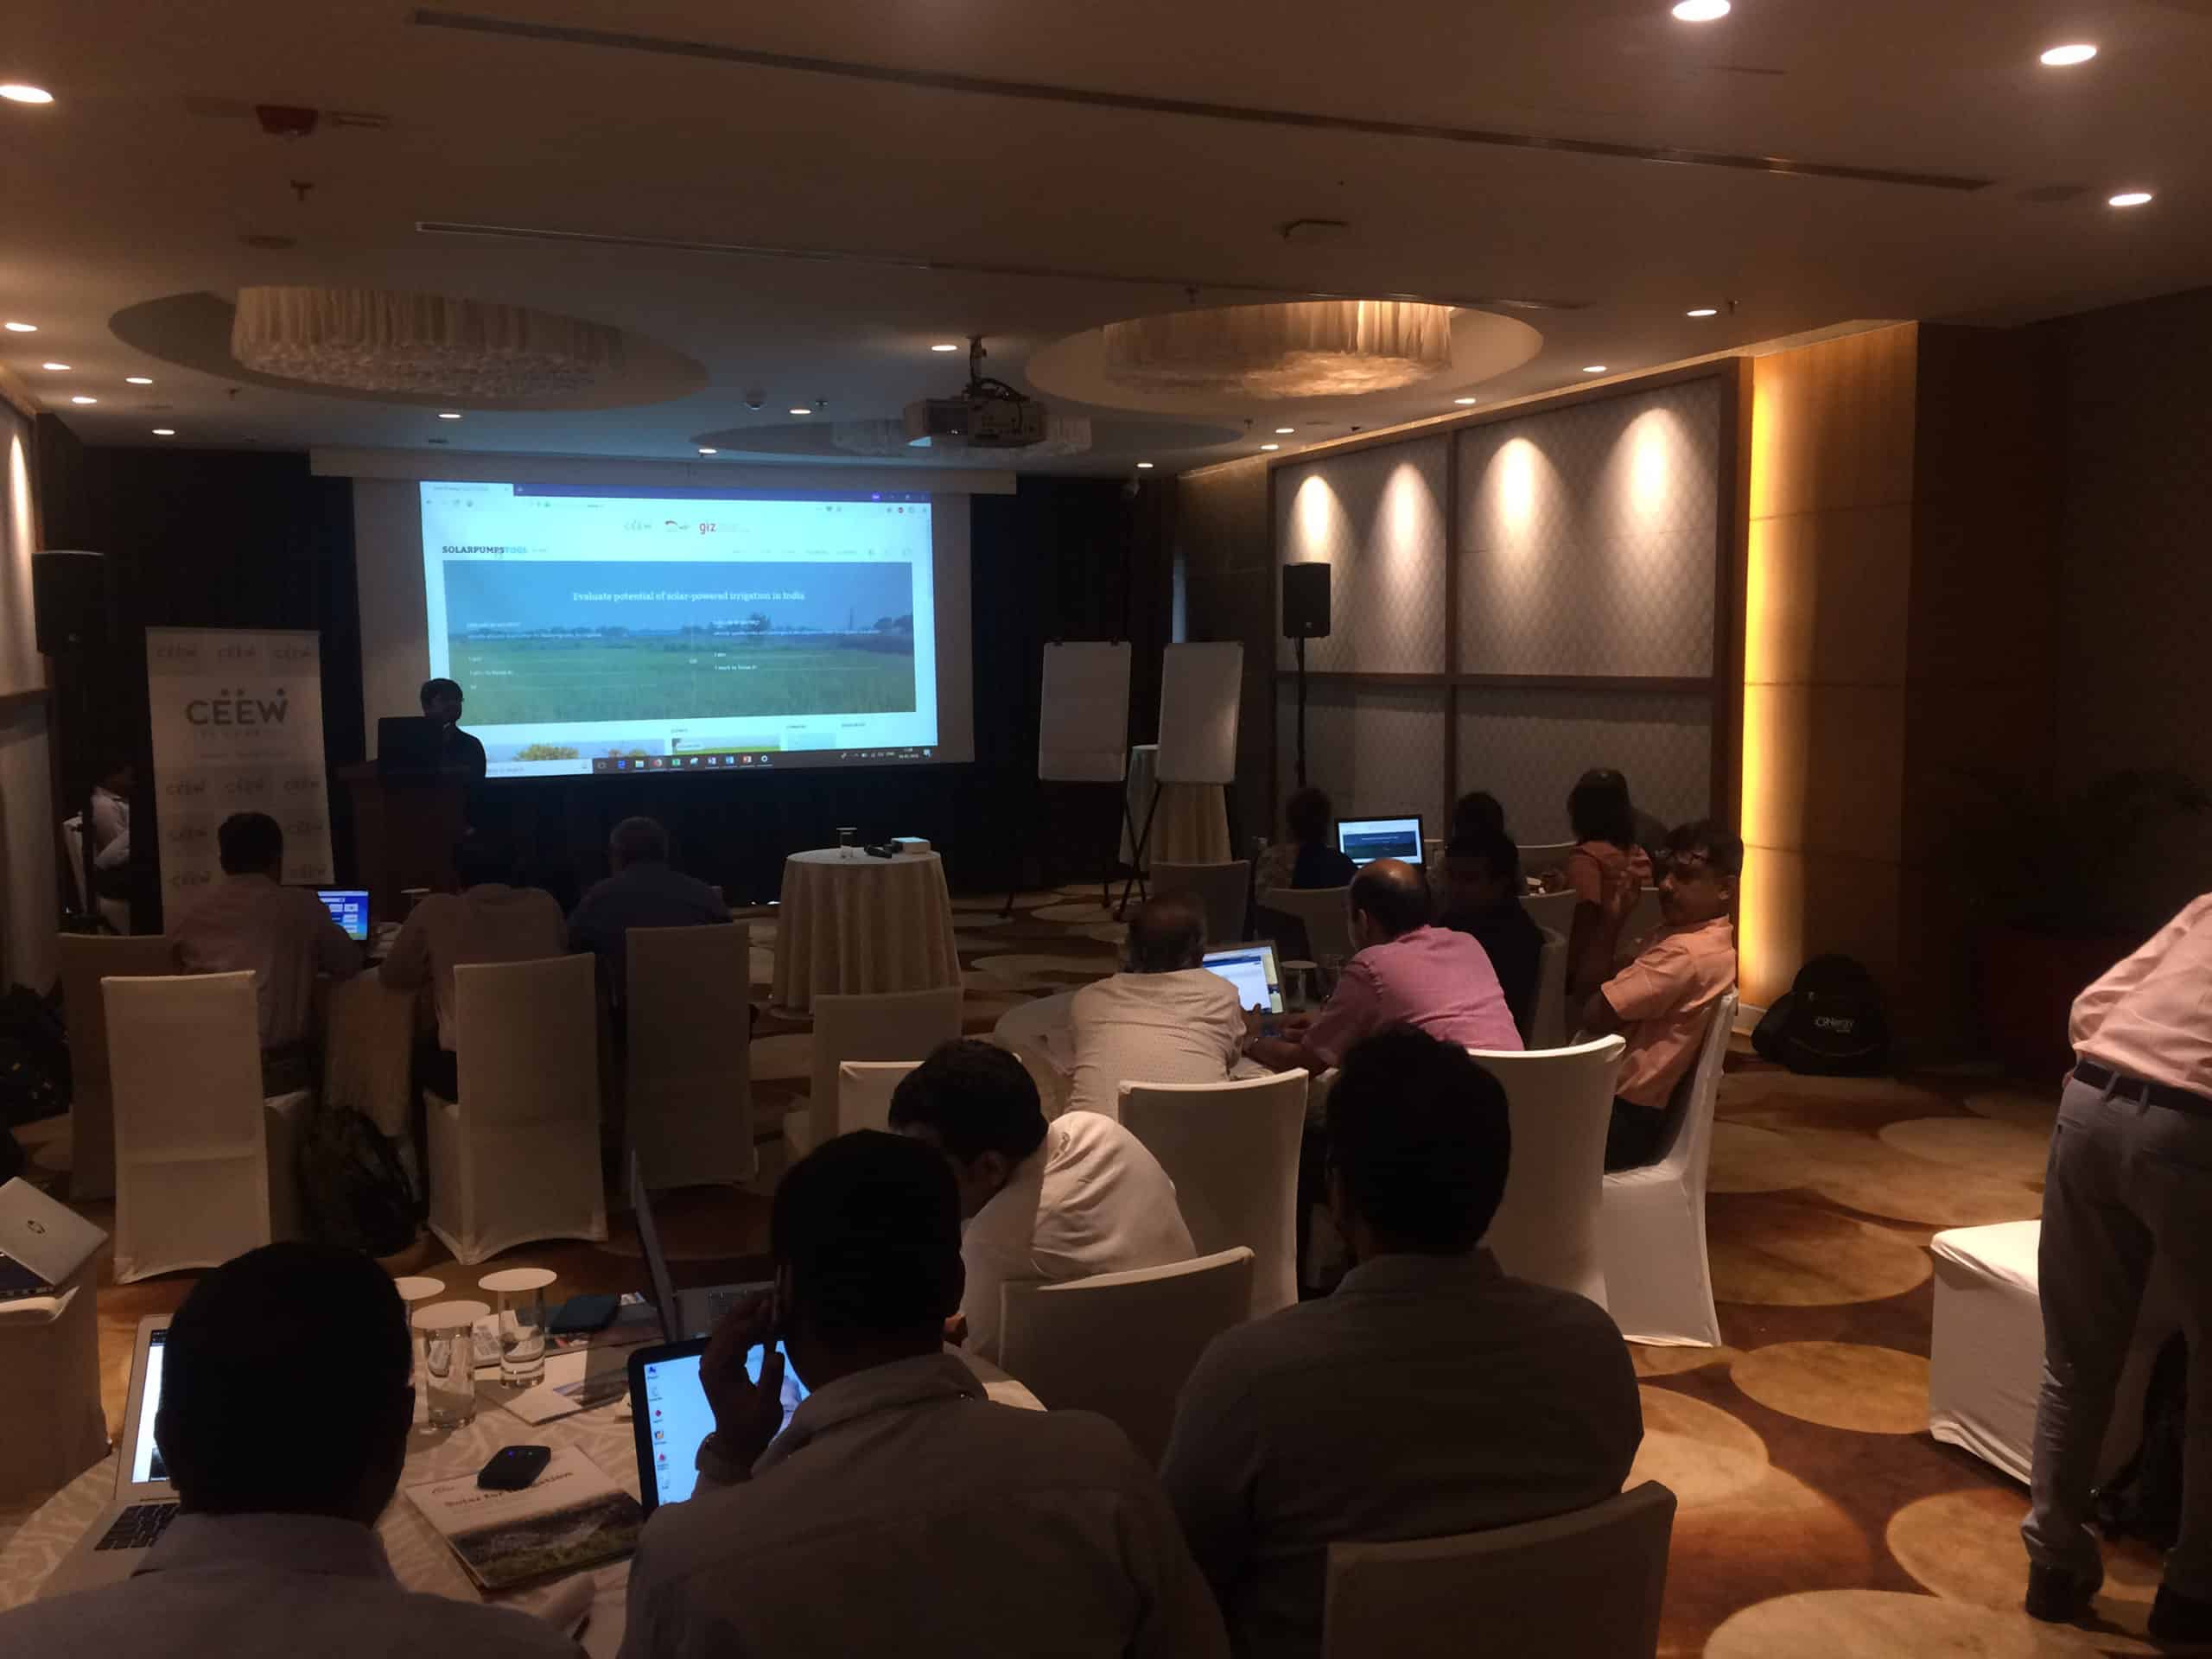
Along with the CEEW team, two tests/training sessions were conducted with policy makers and other relevant audience to evaluate the tool.
The first session was held in Lucknow on 23rd May 2018
The Lucknow session was attended by government officials, L&T’s Solar Power Dept, Academia, Bankers and NGOs.
Audience Reactions — At first glance, the audience liked the tool, they got alert, started opening it in their cell phones. They were happy to see ALL of this data presented visually in one glance. The most excitement was seen among government officials, academia and bankers. More than the India map, the district page generated more interest as they wanted to see what’s happening in their own area of work and how situation can be improved. Audience suggested that the tool should be expanded to hold data for “all” solar devices instead of just solar pumps.
Learning —
- Attendees did not carry laptop despite being asked to. General belief is that cell phones are enough for all browsing. Learning for us was that we need to design mobile first.
- Users did not know that total weights need to be 100. Hence, this education has to happen up front and even as a validation error message.
- People can’t spell. Hence, might need to add fuzzy search to dropdowns.
The second session was held in Kolkatta on 28rd May 2018
In stark contrast to the Lucknow session, the Calcutta session was attended by young, tech enabled crowd, who brought their own laptops.
Audience Reactions — They were excited to see visuals and started engaging with the data themselves. Not everyone in the audience was able to find insights. So the CEEW team had to walk the audience through questions that they can ask off the data. Some found in depth insights using filters concept.
Learning — : UX
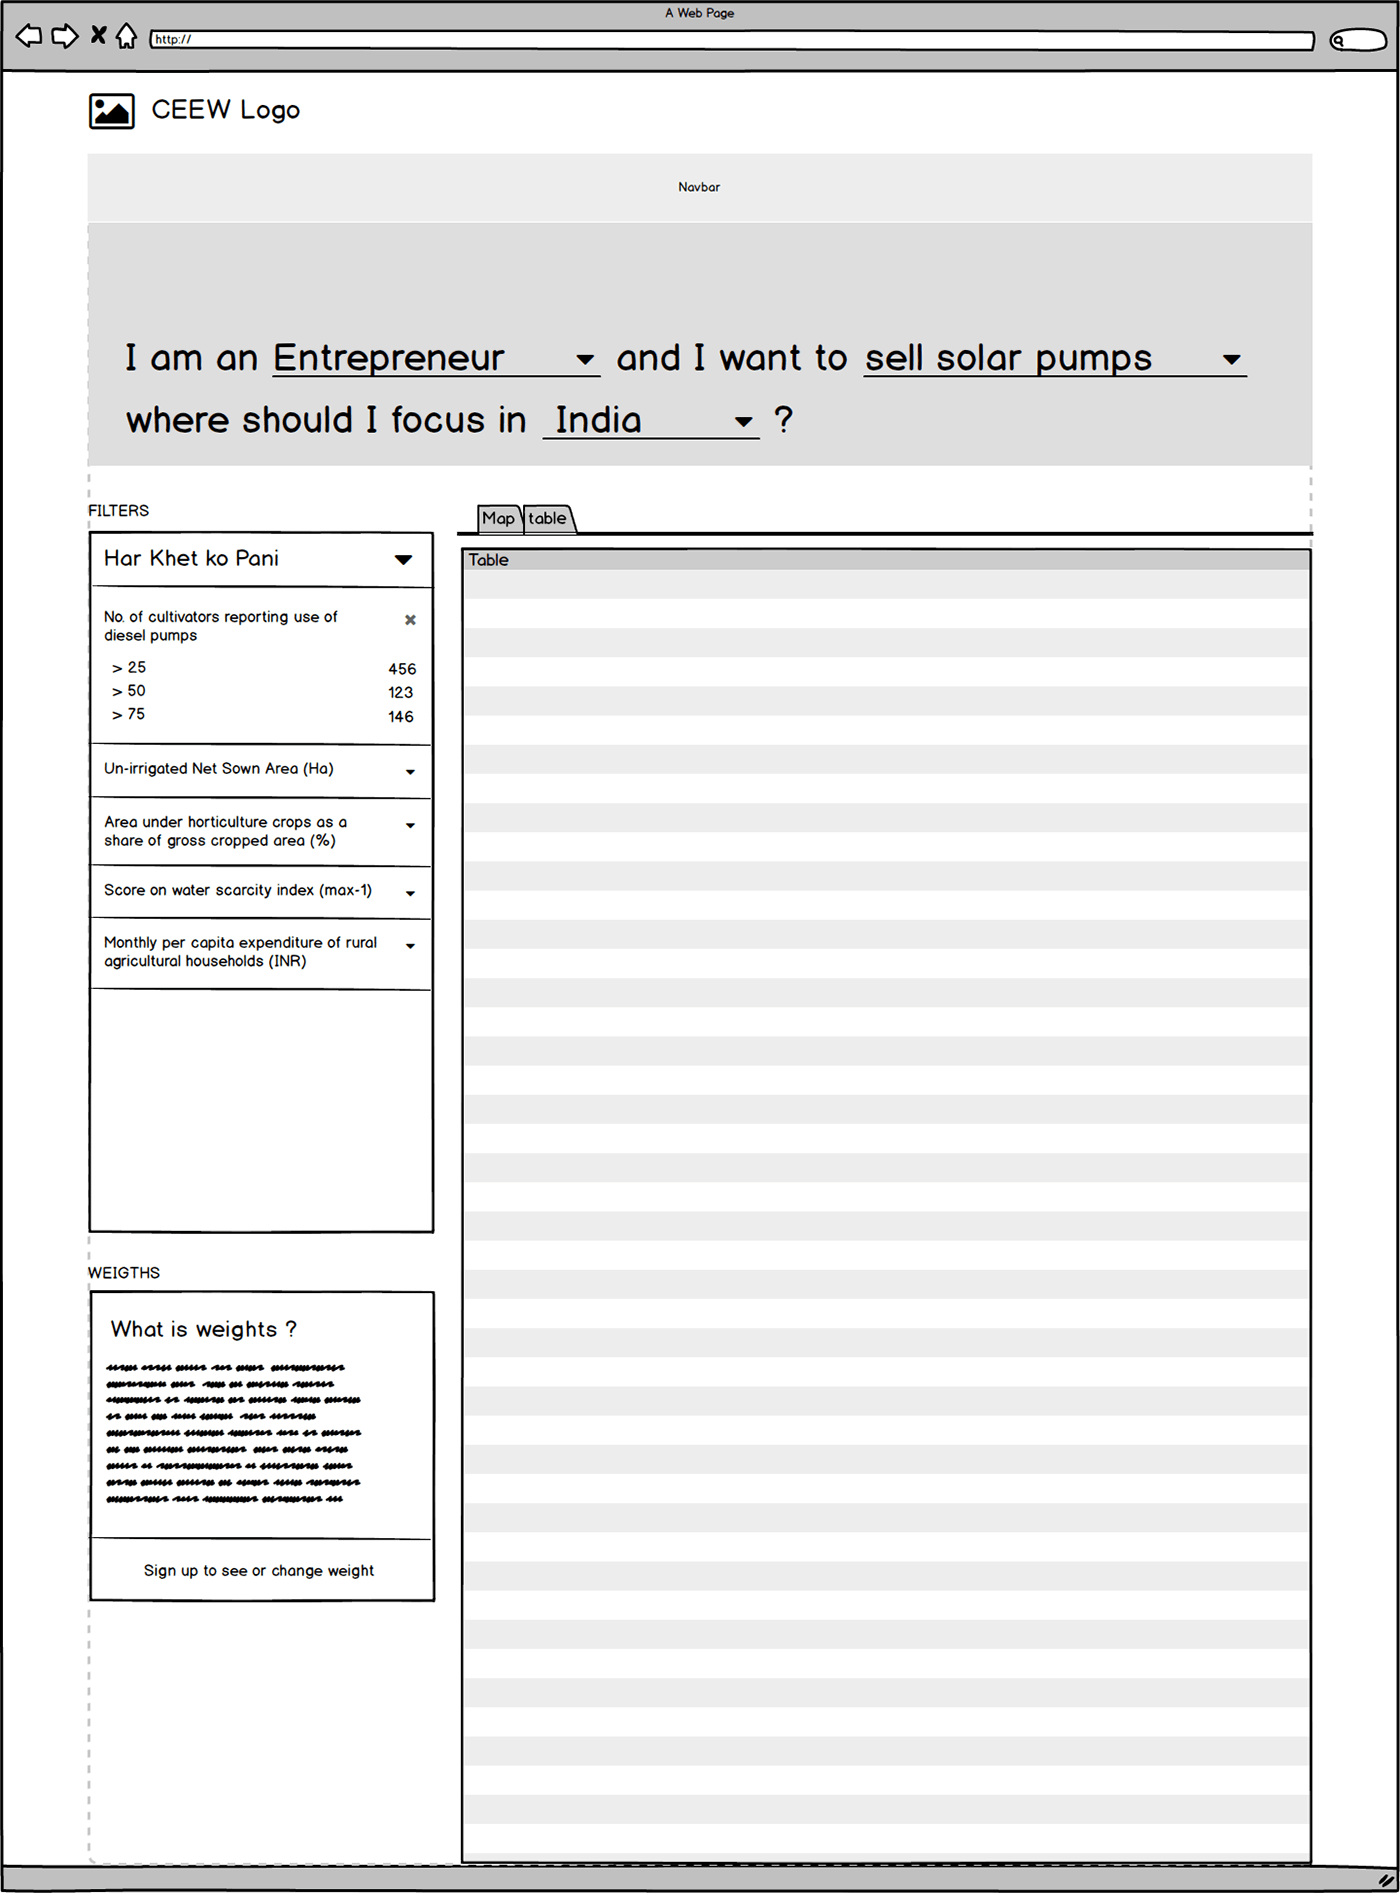
- Need search for districts in table view.
- Load time is slow, specially images.
- Post application of filter, there is wait time until filter is applied on map.
- Improve how selected filters are shown.
- When a user selects a deployment approach and comes to tool page, it says that there are 6 filters pre-applied, however immediately user can see only 2 filters applied. Where are the rest?
- Current design of filters makes user scroll in filter area to find what are the applied filters.
- There should be one apply button to apply all changes done in weights.
- User wanted to know the authenticity of the data (govt data / non govt data). CEEW says they will cover it on the “Sources page”. But I think If people are worried about the authenticity it should be made clear on the main page.
Features requested by users — Download dataset, Educate why should/would a user change weights?, Can you highlight outliers?


