
Are community health workers being allocated efficiently?

Look
We wrote a cases simulator that generated a random number of cases (latitude, longitude) around population centers in India.
See
Attempt #1: K-means
In our first attempt, we used Tableau’s default clustering i.e. K-means clustering. It asked for the number of clusters we wanted.
Observation: The algorithm is unequally distributing the cases across the clusters (one can have 3 cases, while the next might have 18). In fact, there is no guarantee that cases will be assigned to some clusters.

Attempt #2: DBSCAN
Next we wanted to try the DBSCAN method. However, Tableau does not support it. So decided to write the clustering method in Python 2 and pass the required data into Tableau Dashboard via calculated field using TabPy.

Observation: We cannot specify the number of clusters required. This is a necessary requirement in our case since the number of health workers are limited.
Imagine
Attempt #3: Build your own
We did not find any equal point clustering algorithm. Hence, we decided to write our own. The algorithm could be broken down into the following steps:
- The user needs to enter the number of clusters and number of cases
- Find optimal centroids for each of the clusters
- Make clusters of equal size
#1 – Finding optimal centroids
To achieve this NP Hard algorithmic need, K-means clustering uses Lloyd’s algorithm — an iterative method that converges (albeit to a local minimum) in a few steps. The procedure alternates between two operations.
- Once a set of centroids is available, the clusters are updated to contain the cases closest in distance to each centroid.
- Given a set of clusters, the centroids are recalculated as the means of all cases belonging to a cluster.
Below is a GIF that visualizes this process

#2 – Make clusters of equal size
To achieve this capacity constraint problem, we used following steps:
- Calculate the distance matrix that stores absolute values of distance between each point and centroid of each. The matrix size is (Number of clusters x Number of data cases).
- Then each of the cases are assigned to their nearest cluster but this assignment is done only if the number of cases already assigned to a cluster is less than (Number of data cases / Number of clusters).
- If for a point the nearest cluster is completely occupied then it looks for the next nearest cluster and so on until it is assigned to a cluster.
- This process goes on until all the data cases are assigned to one of the clusters.
- On the basis of this newly formed clusters, the centroid is updated followed by the update in distance matrix. This process goes on in a loop until the centroids stop changing or there is no change in the clusters formed i.e new clusters formed in the latest iteration have exactly the same cases as they had in the previous iteration.

Observation: We got 10 clusters with 10 cases each. On trying the algorithm with another dataset, we realized that all health workers might not travel similar distances. Turns out, the cases entering the cluster assignment process first get the closest clusters, while the cases entering last may not be assigned to their nearest cluster but to the nearest cluster from the set of remaining clusters.

Attempt #4: Refine the algorithm
To achieve this, we decided to track all cases that were not assigned to their nearest cluster due to capacity constraint. We iterate over this list:
- Make swaps between point #1 in that list with all other cases in the same list if both cases are not from the same cluster.
- After a swap takes place we update the coordinates of the centroid of both the clusters between which these locations are interchanged. The remaining clusters won’t observe any change.
- After the centroid coordinates are updated we update the distance matrix (again change is only observed in two of the clusters )
- Using the updated distance matrix we calculate the distance a volunteer will have to travel within a cluster. This is done for all the clusters.
- Then using this Intra cluster distance data we calculated the difference in distance traveled by each volunteer. We calculate this difference for every possible pair cluster i.e nC2 pair.
- After this, we take the sum of all these differences and try to minimize it.
- Swap for which this sum of difference is minimum is selected.


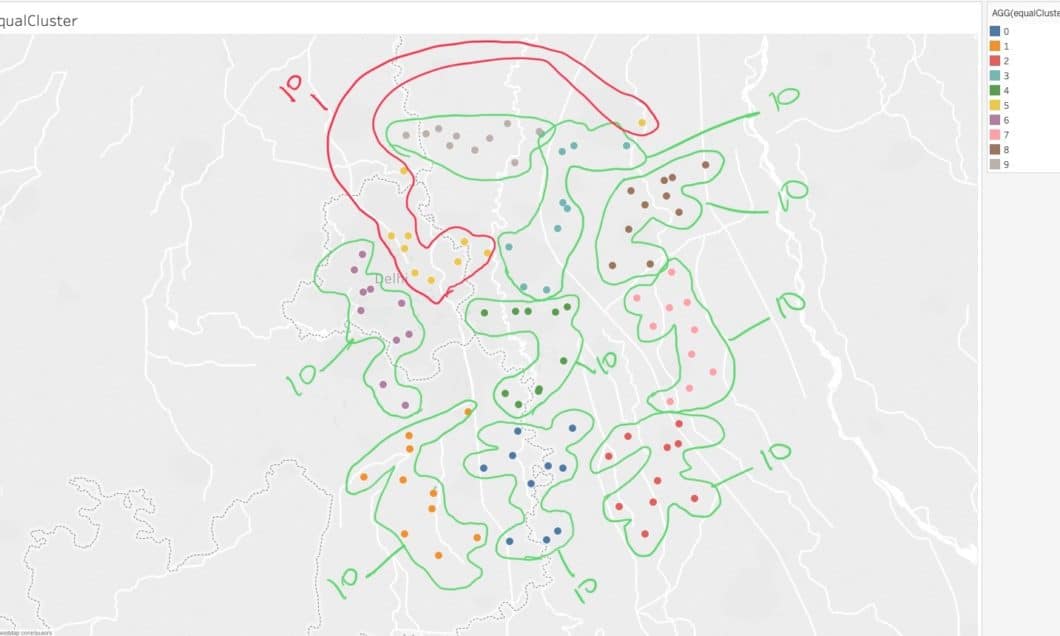
5.1 Clearly, it would not make sense to equal cluster cases from Delhi and Mumbai… Hence the first step would be to group together cases that are close to each other based on distance (usually Euclidean distance). For this, we used DBSCAN.
Attempt #5: Regional Clustering
Until now, we were evaluating clusters around one population centers. Next, we try to do regional level clustering.

5.2 Finally, we apply the equal intra-clustering algorithm within each region.

Attempt #6: Proximity Clustering
Some points in the dataset were really close together, so much so, that they could be considered the same point. So we needed to add a preprocessing step, that would condense all these points into a single point.
As an example, suppose 30 points are really close together, in equal clustering, a case worker would be assigned that same area 30 times, which would create an unbalanced workload.
To achieve this “proximity clustering”, we applied DBSCAN to form clusters, with a very small threshold distance. Outliers were left alone, but all rows in the data that were included in a cluster were removed. A new row was created using the centroid of the cluster.


A Calculated Field was added to the tooltip, called LogOfCount. This field calculated the log to the base 2 of the number of points that created a condensed point. Using this field, a size variation was created in Tableau, to distinguish highly dense points from lesser dense ones. Taking Log was important, to have a better scale of the sizing, otherwise the outliers were really small, while the high density points were really large.
Media mentions
The project got featured at https://www.tableau.com/foundation/featured-projects/operation-asha